Worked example · Mathematics
Simultaneous equations: where two lines cross
Two equations, two unknowns, one answer that satisfies both. On paper you eliminate a letter; on a graph you look for the crossing. They are the same thing seen from two directions, and knowing that is what saves you when a pair has no solution at all — or two.
Solving simultaneous equations by substitution
Solve these together:
The second equation is easy to rearrange, so use it: x = y + 3. Put that into the first in place of x:
3(y + 3) + 2y = 16 → 3y + 9 + 2y = 16 → 5y = 7 → y = 1.4, and then x = 1.4 + 3 = x = 4.4.
Always put both numbers back into both original equations, not just the one you rearranged — a slip in the substitution will still satisfy the equation you took it from:
- (
- 3
- ×
- 4.4
- )
- +
- (
- 2
- ×
- 1.4
- )
- =
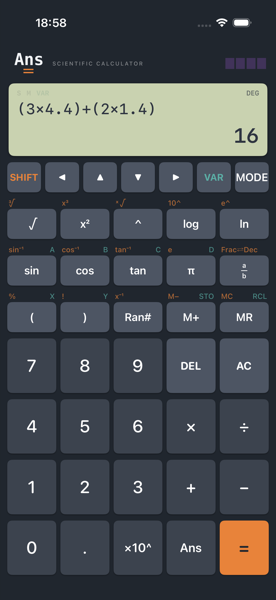
And 4.4 − 1.4 = 3 for the second. Two ticks, and the answer is x = 4.4, y = 1.4.
The same answer, as a crossing
A graph plots y against x, so each equation has to be rearranged into the form y = something. That rearrangement is the whole preparation, and it is worth doing carefully:
3x + 2y = 16 → 2y = 16 − 3x → y = 8 − 1.5x, and x − y = 3 → y = x − 3.
f₁(x) = 8-1.5x f₂(x) = x-3
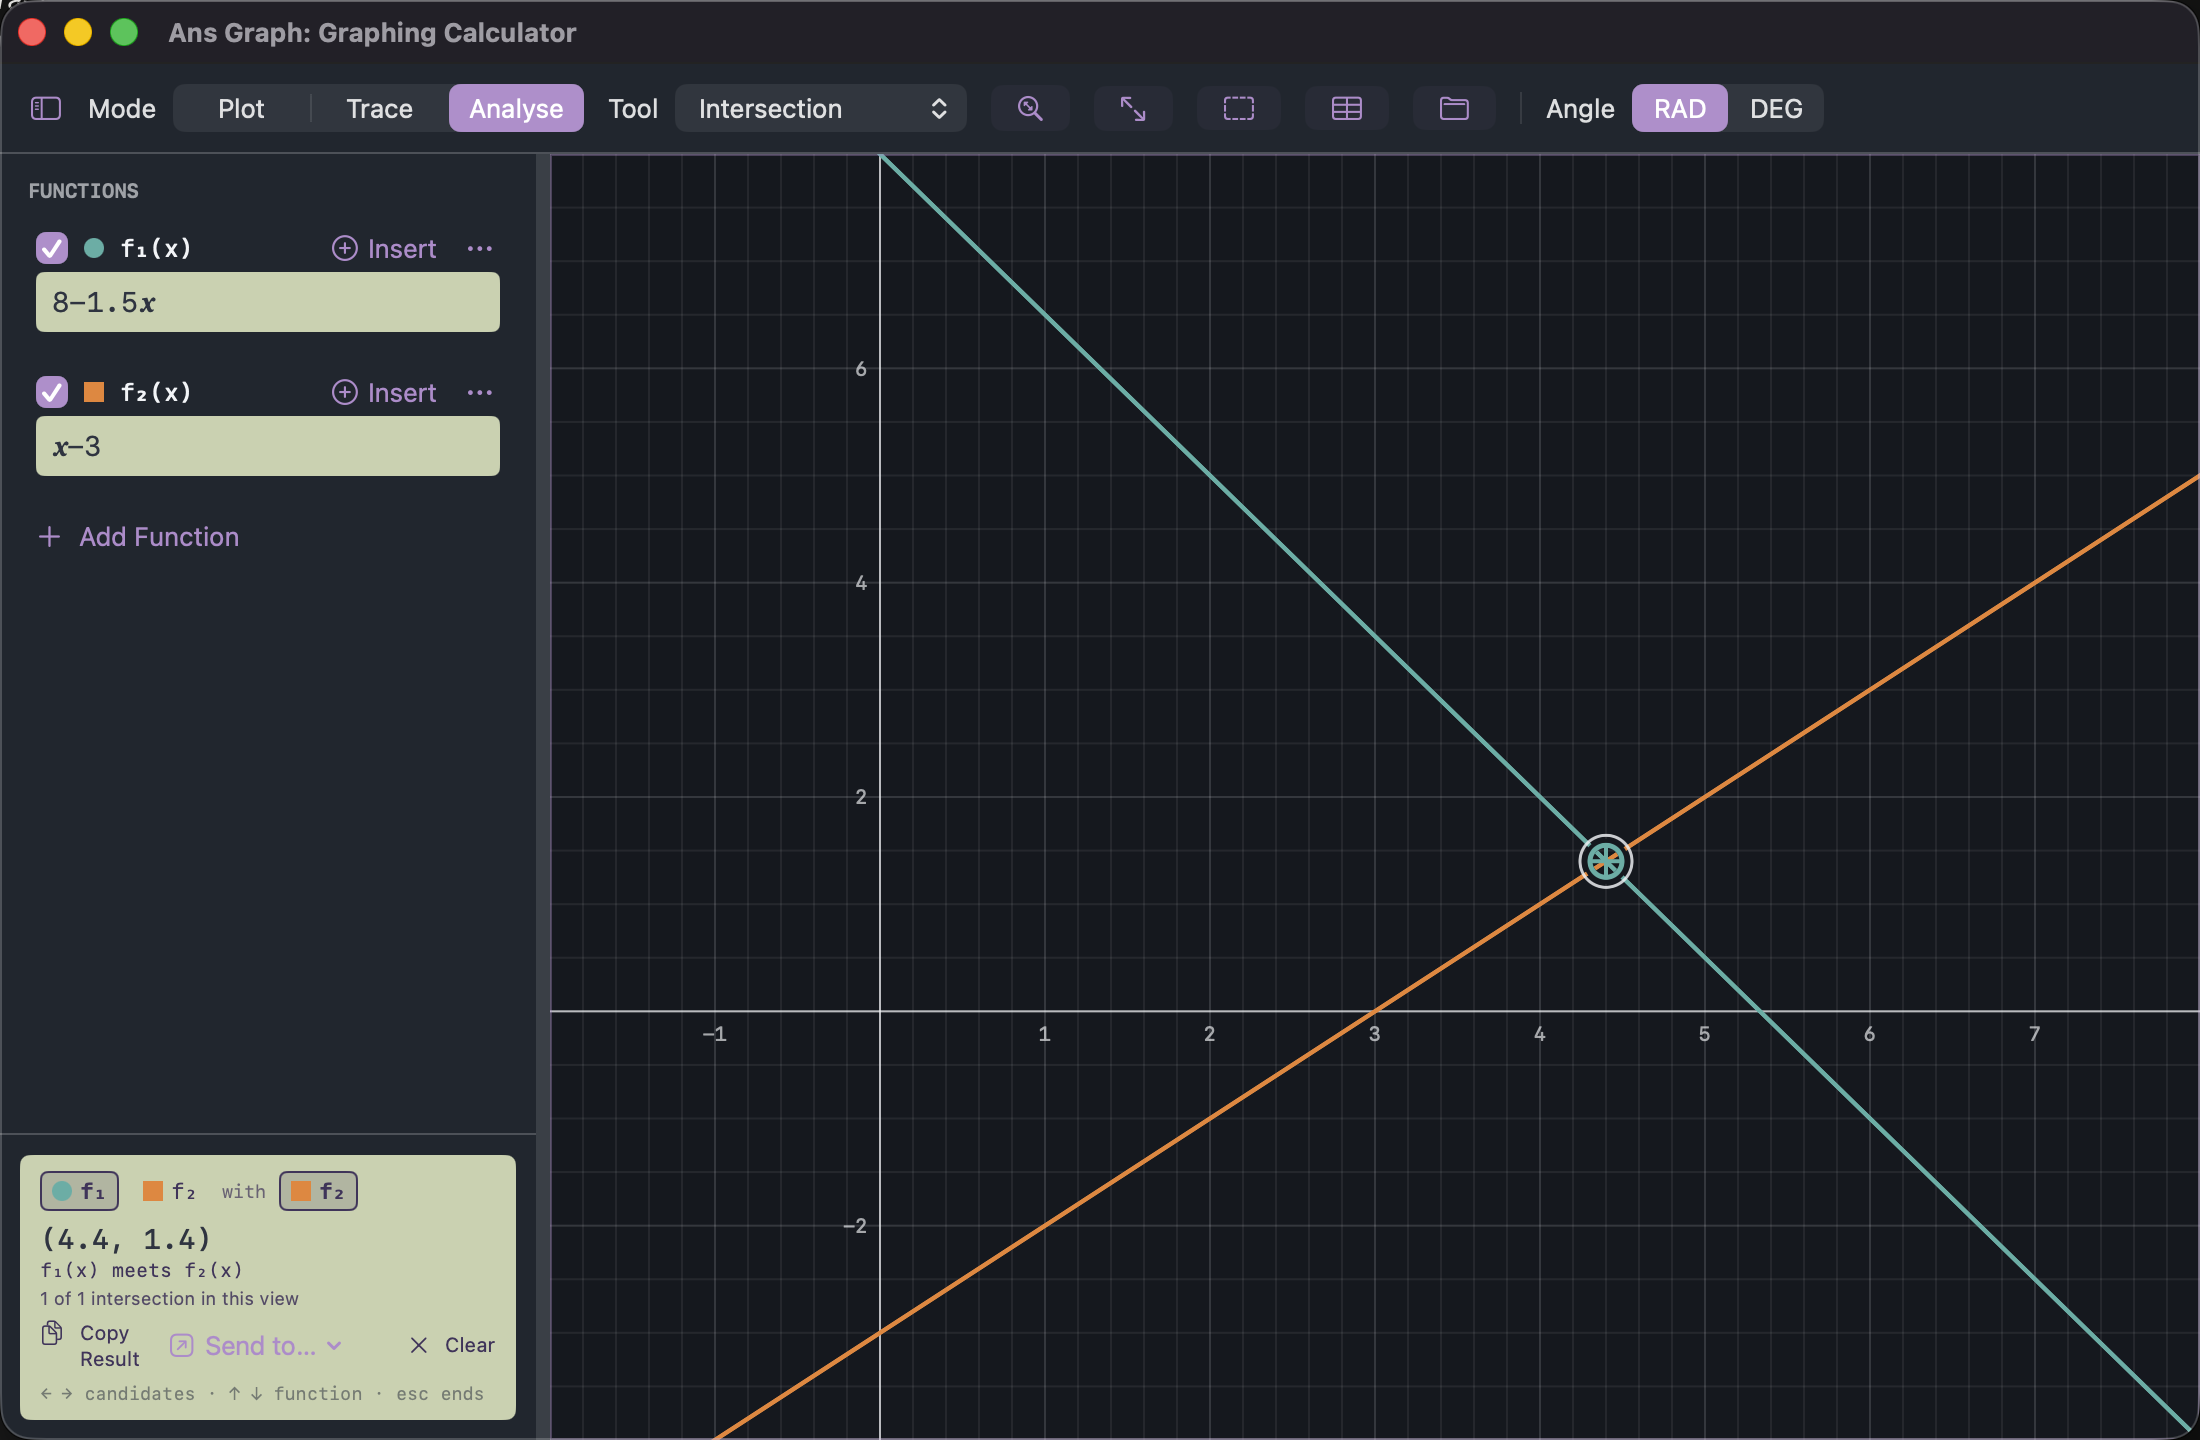
That is what "solving simultaneously" means geometrically: a point that lies on both lines at once. The algebra finds it by removing a letter; the graph finds it by removing nothing and simply looking at where the two constraints agree.
Rearranging is where marks are lost, not solving. The commonest error in this whole topic is a sign — writing y = 3 − x instead of y = x − 3. The graph catches it instantly: the wrong line has the wrong slope and crosses somewhere absurd. If your crossing does not look like your answer, suspect the rearrangement before the arithmetic.
When the lines never meet
Not every pair has a solution. Try these two:
Eliminate x by halving the first: x + 2y = 5. But the second says x + 2y = 8. The same quantity cannot be 5 and 8, so there is no solution — and on paper that appears as a contradiction with no obvious picture attached to it.
f₁(x) = 2.5-0.5x f₂(x) = 4-0.5x
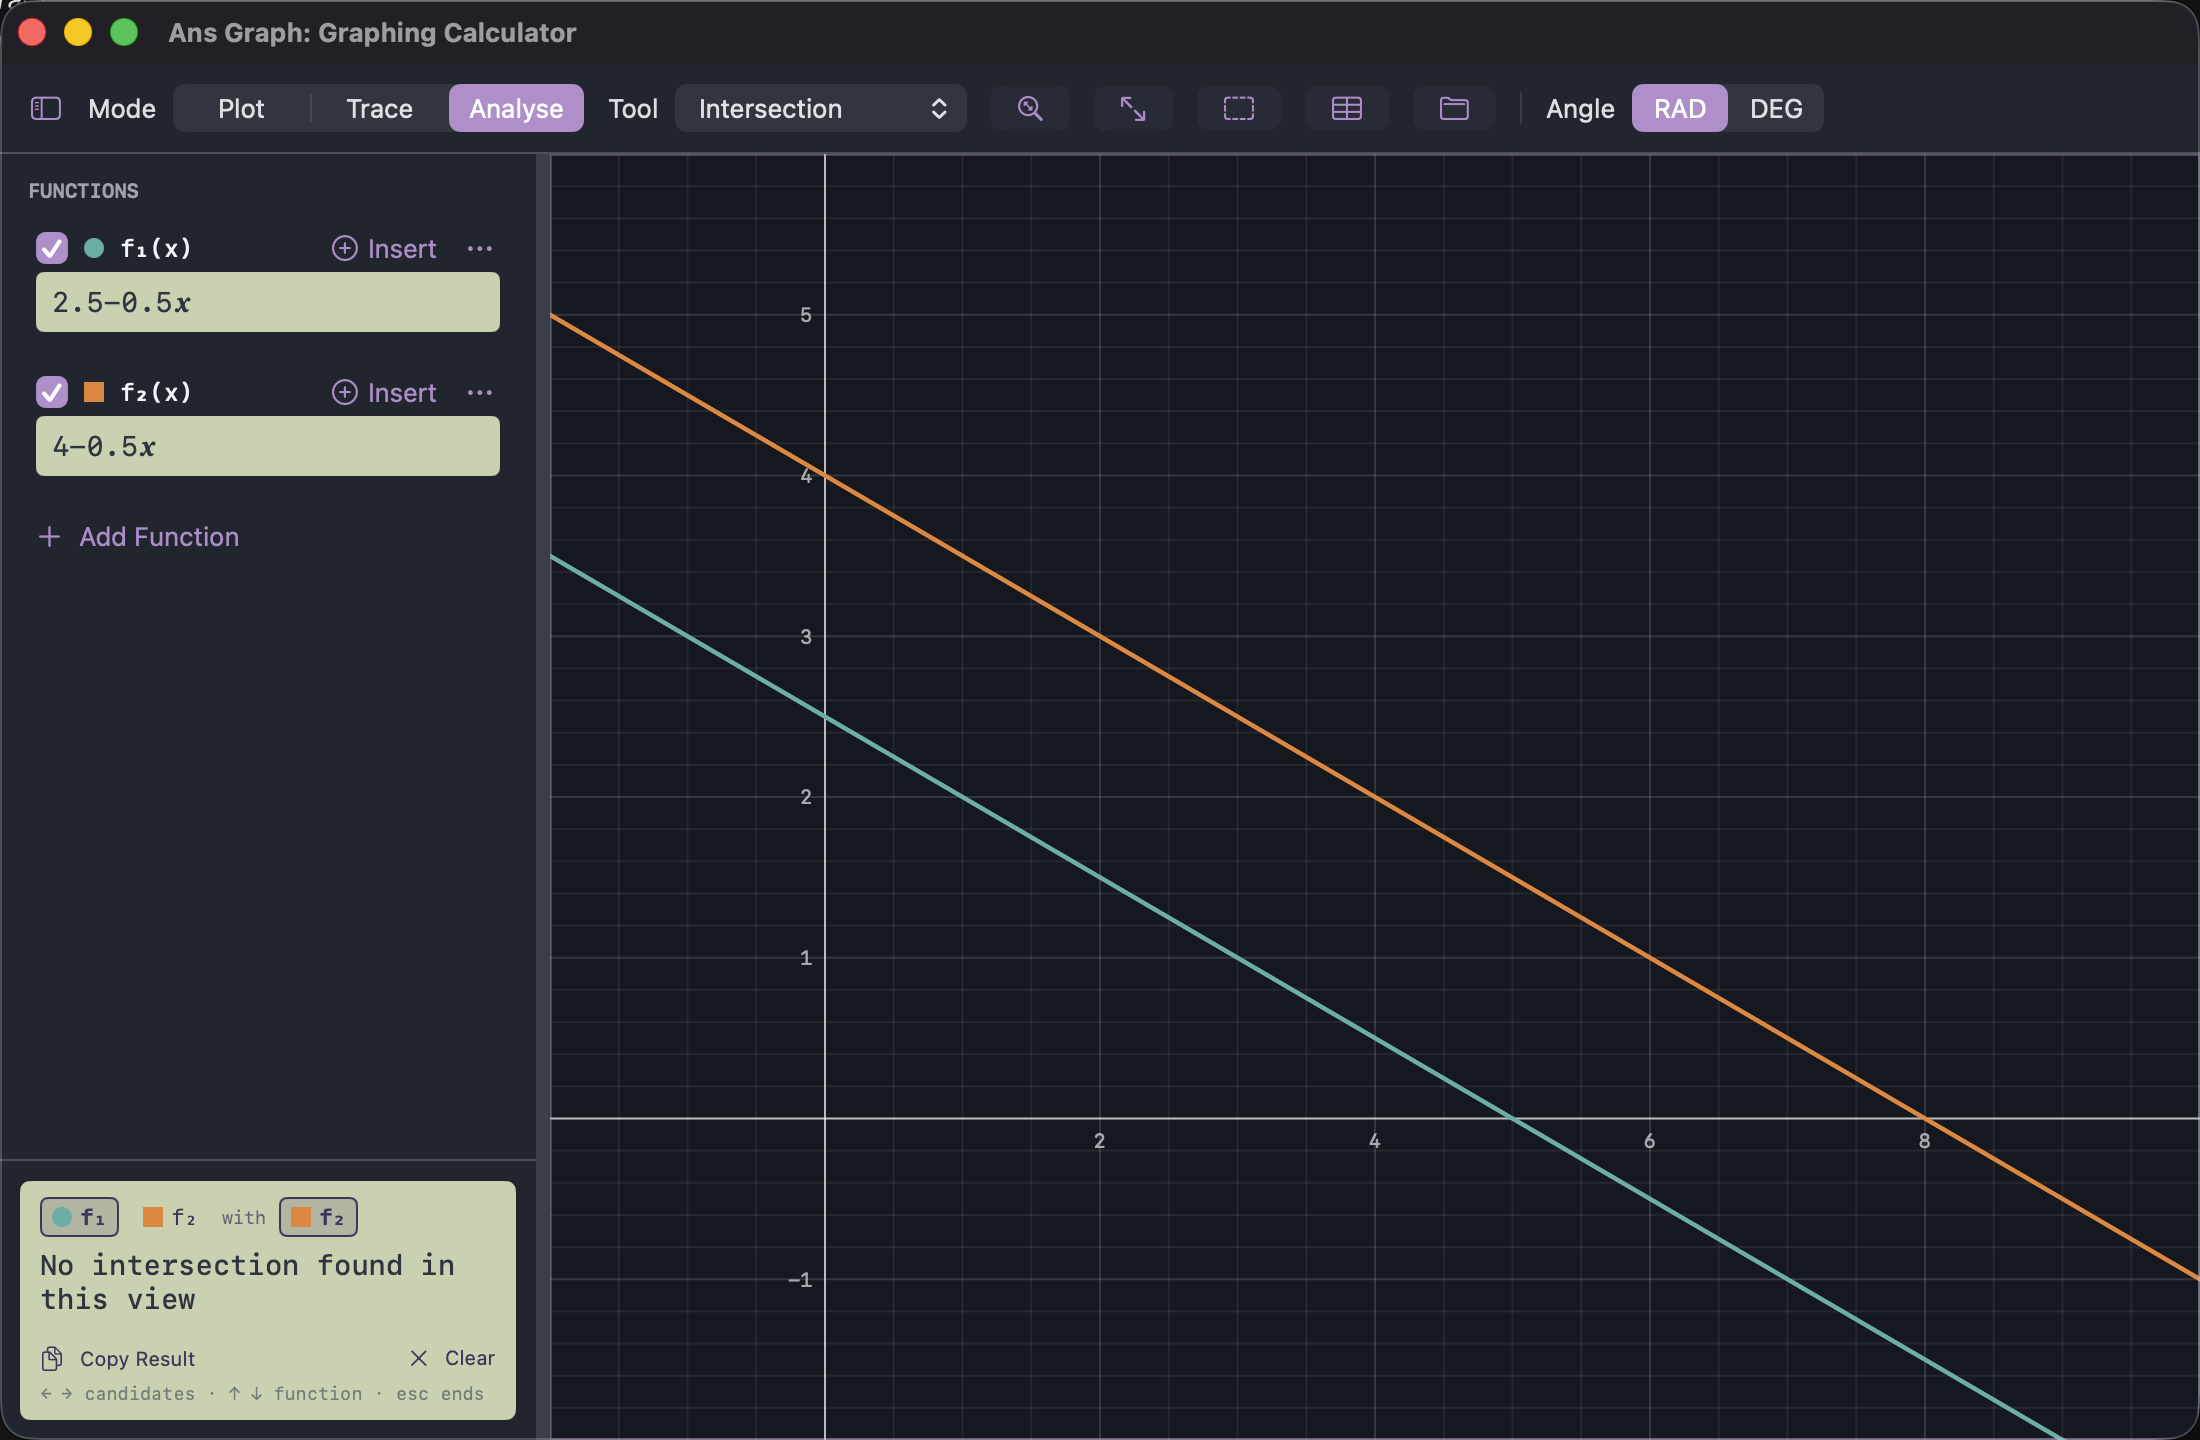
The picture is the explanation. Both equations describe lines of gradient −0.5; they are the same direction held at different heights, so they run alongside each other forever.
Change one digit and you get the opposite answer
Make the second equation x + 2y = 5 instead of 8. Halving the first gives exactly that, so eliminating x leaves 0 = 0 — true, and completely uninformative. Both equations are the same line written twice, so both plot as f(x) = 2.5-0.5x and the second is drawn straight over the first: you type two functions and see one line. Every point on it satisfies both equations, so this pair has infinitely many solutions rather than none.
On paper those two outcomes look almost the same — one variable vanishes and you are left staring at a statement about numbers. The difference is whether that statement is false (5 = 8, no solution) or true (5 = 5, infinitely many). On the graph they could not look less alike: two lines that never touch, or one line where you plotted two.
When one of them is not a straight line
Nothing about "simultaneous" requires straight lines. Take a curve and a line together:
Setting them equal gives x² − 3 = 2x, or x² − 2x − 3 = 0 — which is a quadratic, and factorises as (x − 3)(x + 1). So x = 3 or x = −1, and the matching y values are 6 and −2.
f₁(x) = x^2-3 f₂(x) = 2x
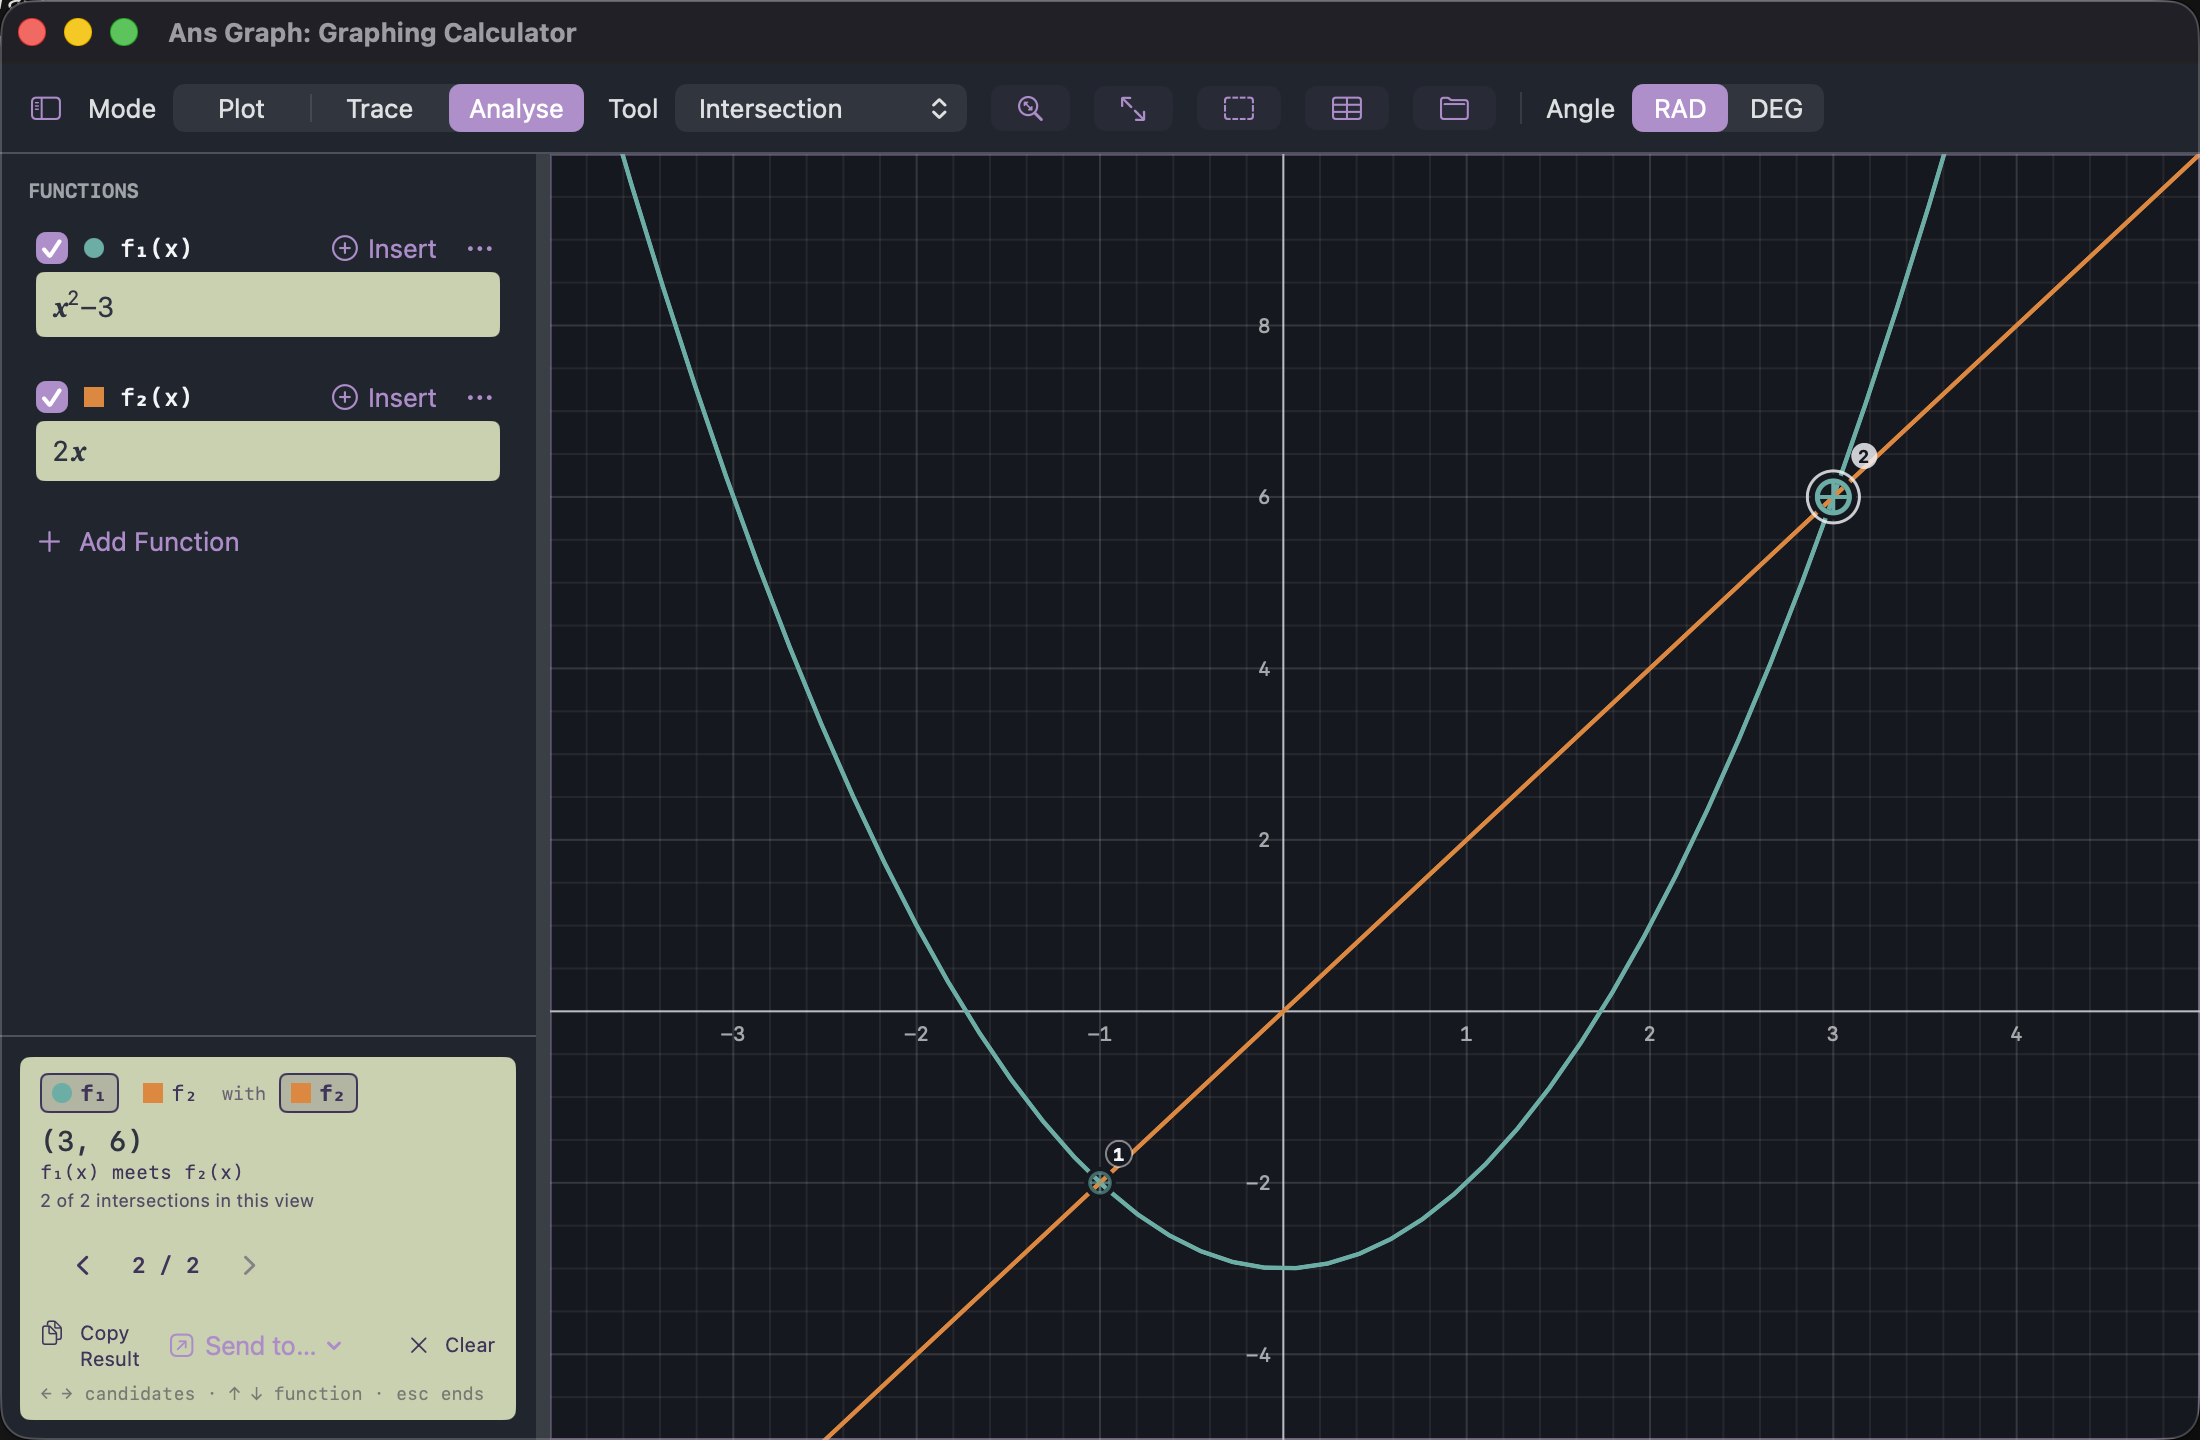
This is where the graph stops being a check and starts being the safer method. Nothing in the algebra announces how many answers to expect; the picture does, before any solving happens. And when the resulting quadratic will not factorise, the quadratic formula finishes the job — or the app's Intersection tool skips it entirely.
The three pairs, side by side
| Pair | Solutions | On the graph |
|---|---|---|
| 3x + 2y = 16, x − y = 3 | x = 4.4, y = 1.4 | one crossing |
| 2x + 4y = 10, x + 2y = 8 | none | parallel lines |
| y = x² − 3, y = 2x | (3, 6) and (−1, −2) | two crossings |
What to watch
- Every equation must be rearranged to y = … before it can be plotted. A vertical line, x = 4, cannot be drawn as a function of x at all — solve that pair by substitution instead.
- Intersection reports only what is in the current view. Two curves can cross again off-screen; fit the plot before trusting a count.
- The graph's coordinates are numerical and stated to the resolution the window earns. Where the algebra gives exact values — 4.4 and 1.4 here — those are the ones to quote.
- "No solution" and "infinitely many solutions" look completely different on a graph and nearly identical on paper. That is the strongest reason to sketch a pair you are unsure about.
Next: quadratic equations, which is where step 4 leads when the factorising stops working.
- Free
- No ads
- No tracking
- No account
- Every sum shown in full
Worked on Ans — a scientific calculator you can own and Ans Graph, whose Intersection tool counts the answers before you look for them.