Roots and intersections
Find the candidates in the current view, step between them and see each coordinate on the graph.
Graphing calculator for iPhone, iPad and Mac
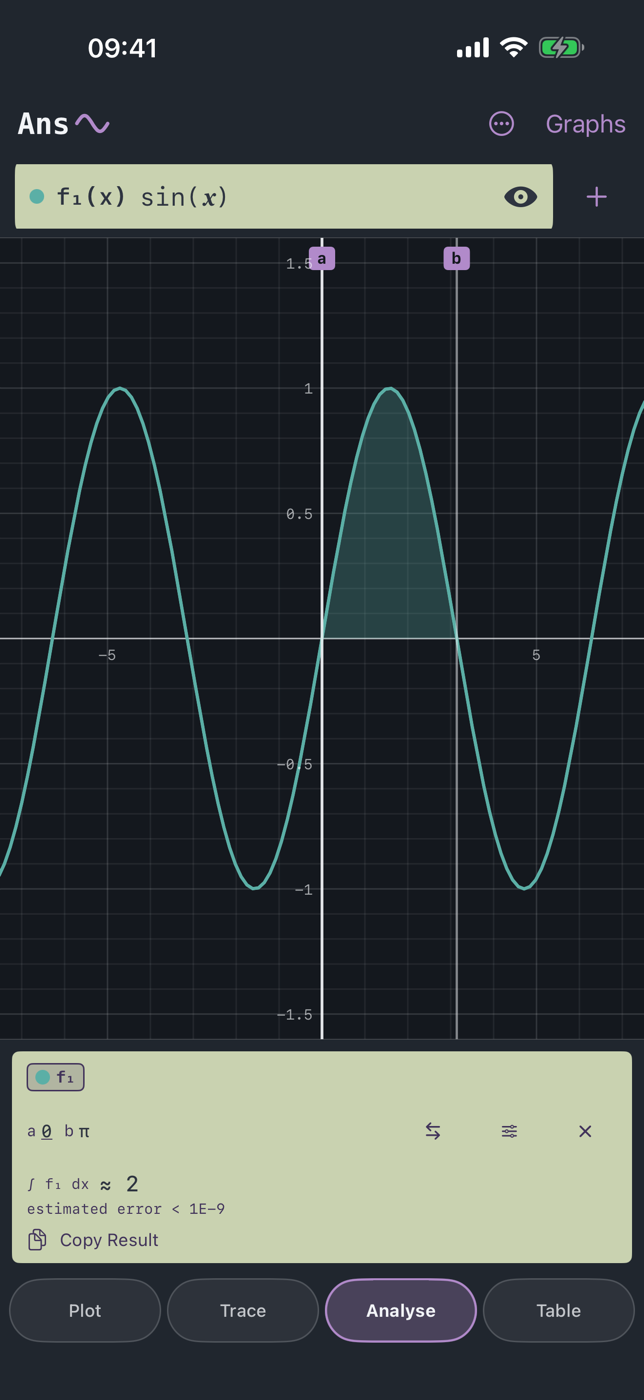
Ans Graph puts numerical integration where it belongs: the shaded region on the graph and the value beside it. Move either bound and both respond together.
And on the Mac
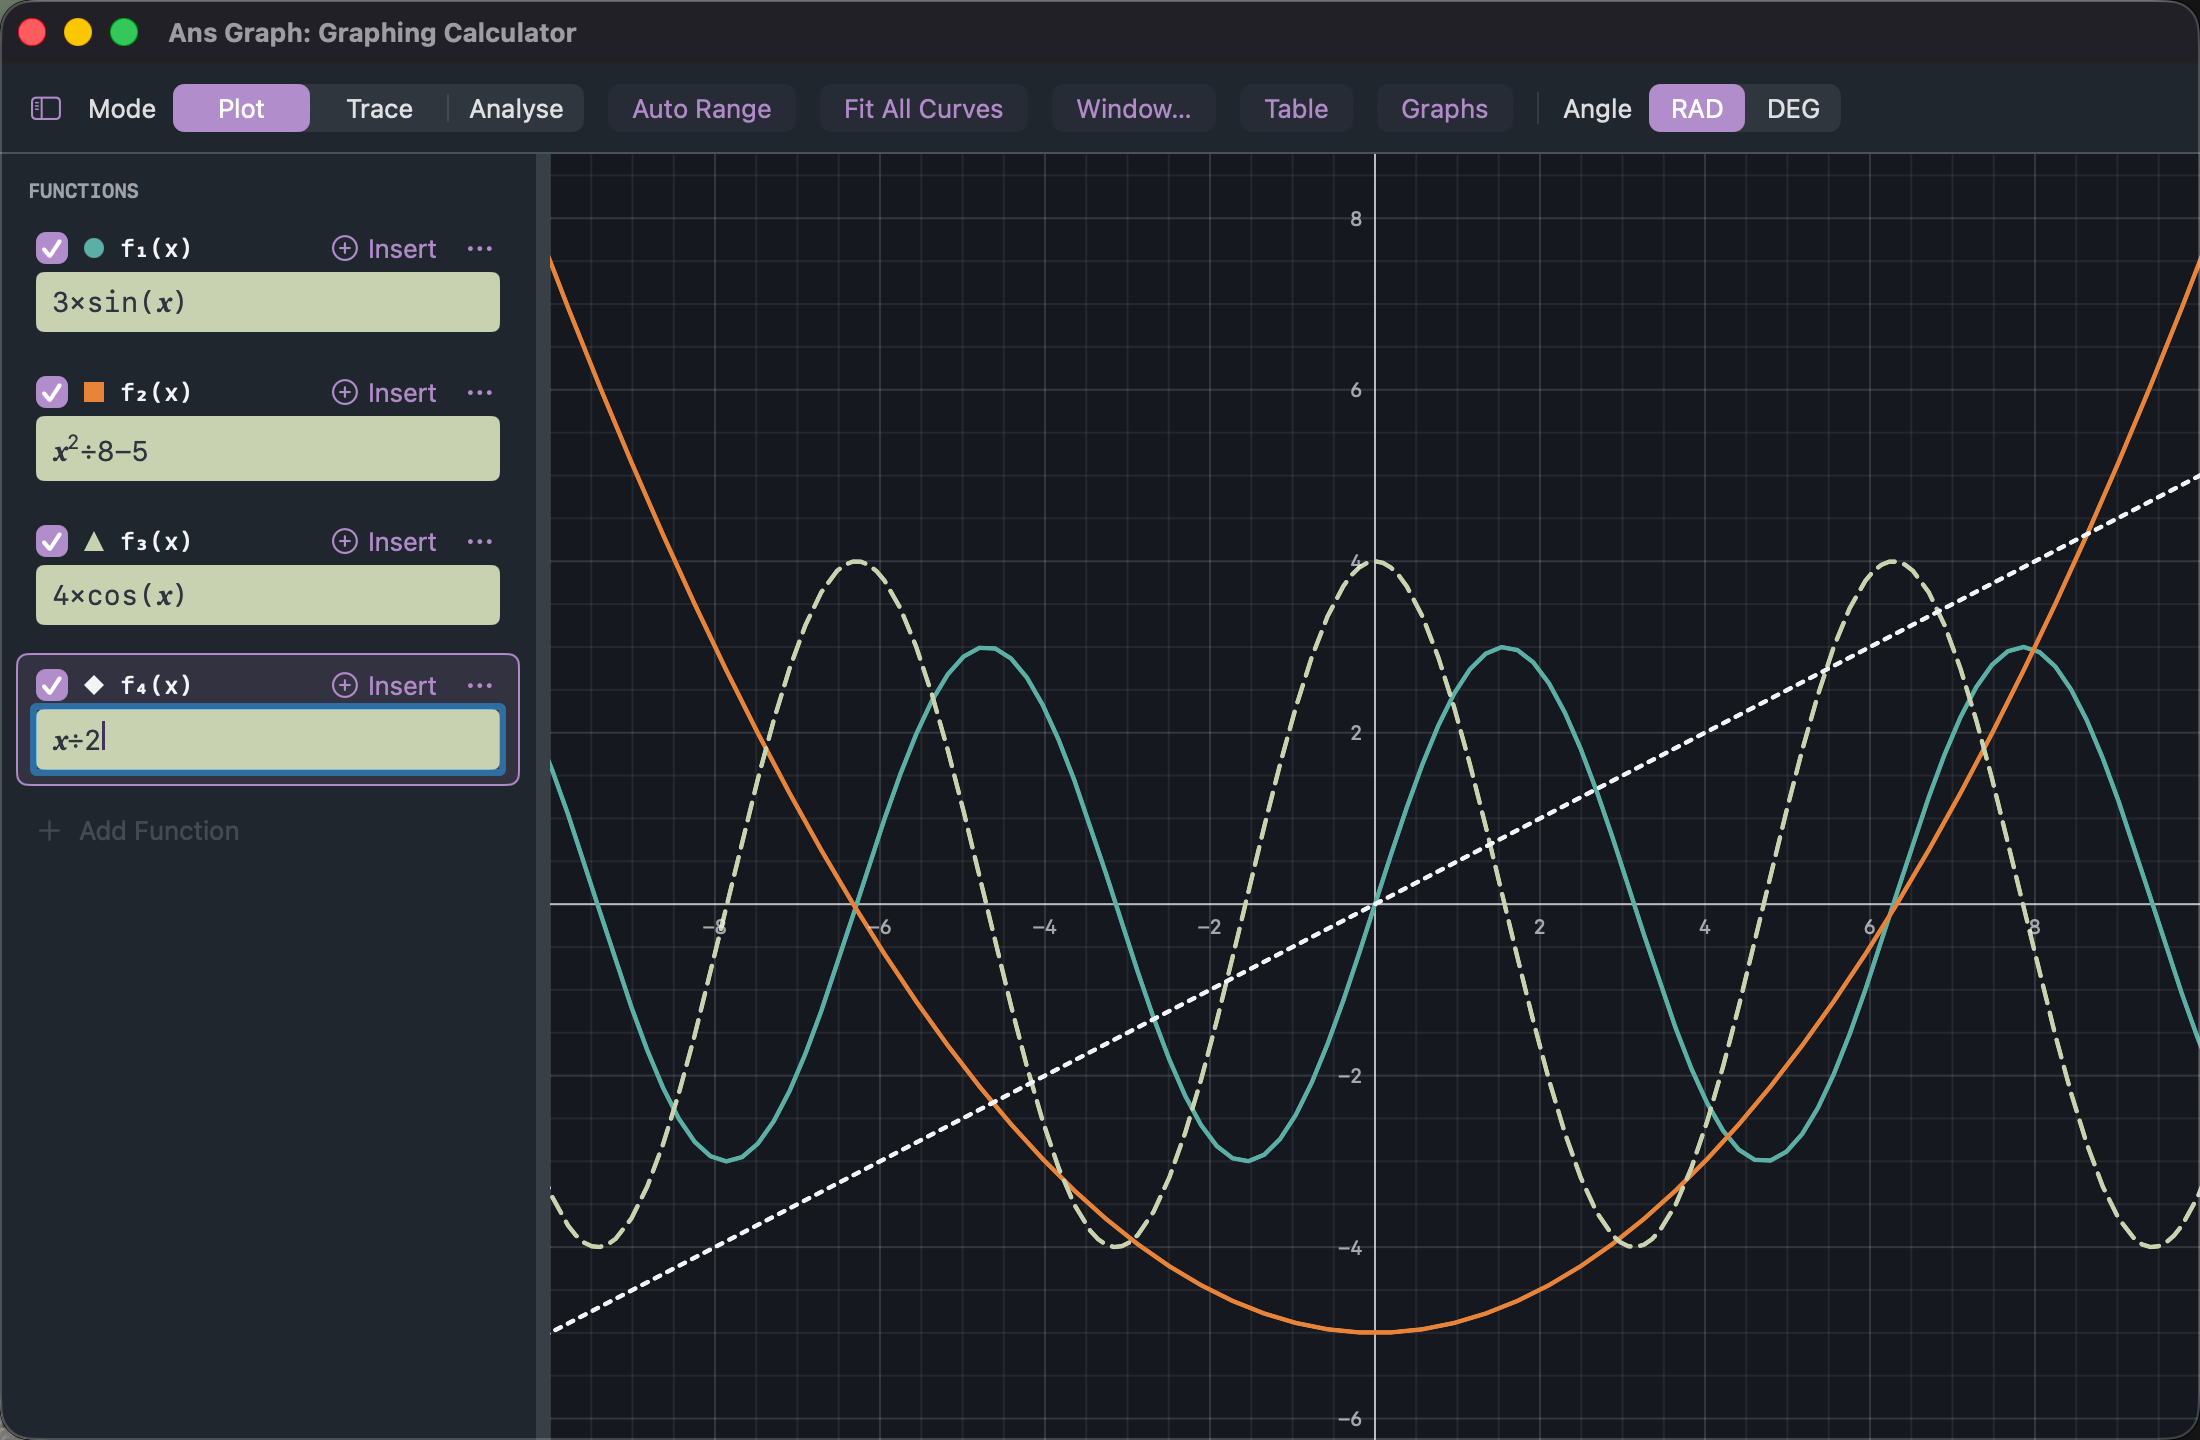
A resizable window with the function rail beside the plot, a menu command for everything and a keyboard shortcut for most of it. Four functions at once, each with its own colour, line pattern and token, so they stay four things rather than a tangle.
Included in the same purchase: buy Ans Graph once and it is yours on iPhone, iPad and Mac.
The real app
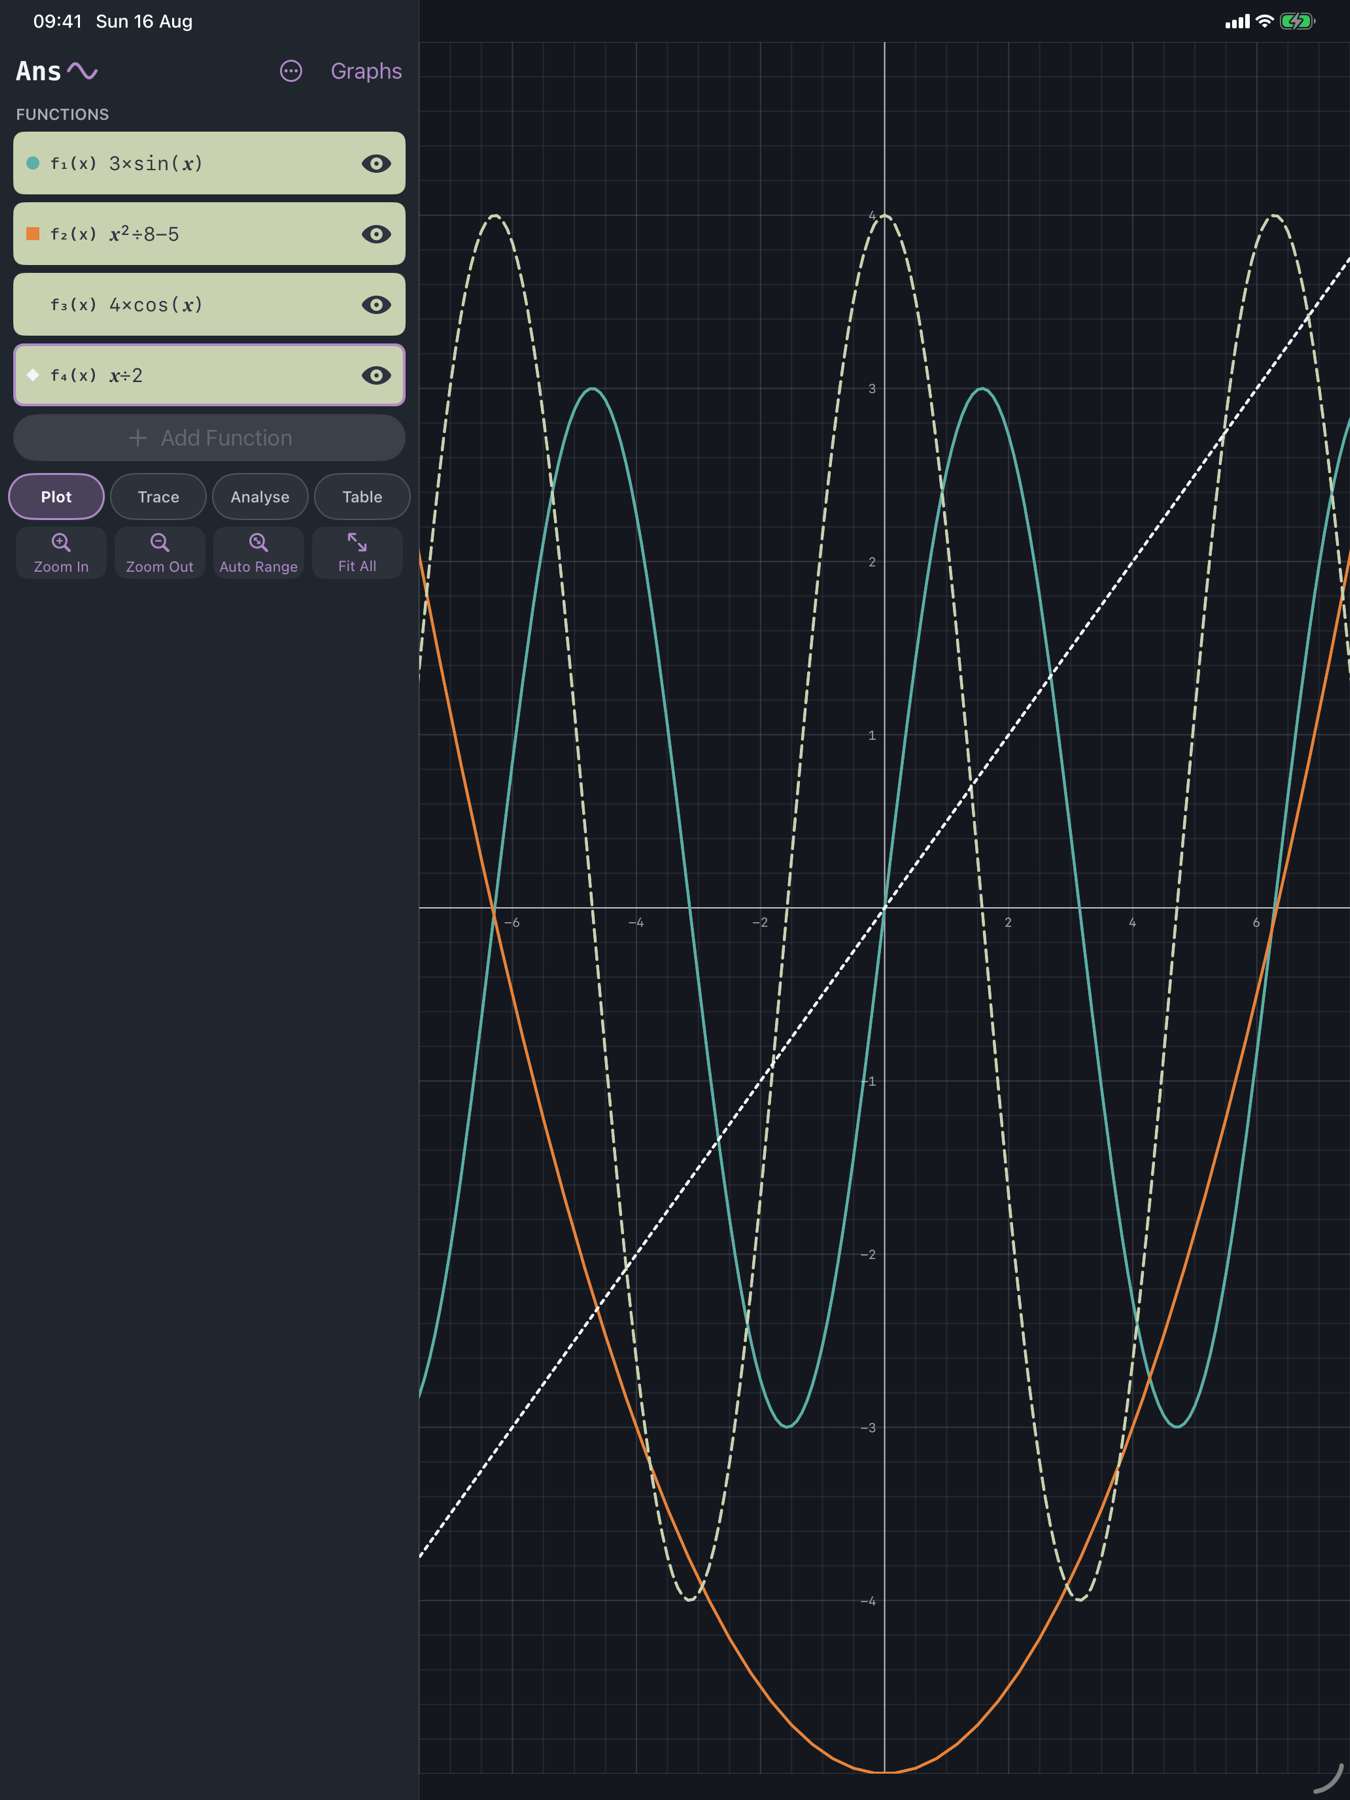
The same instrument on both: the shaded area and its value in one hand, and every function listed beside the plot on the larger screen.
Read the curve
A plotted line is the start, not the result. Ans Graph gives the important points a value, a place and an honest statement of what was found.
Find the candidates in the current view, step between them and see each coordinate on the graph.
Choose a point and read the local slope with its tangent, so the number stays attached to the shape.
Move along a curve for live coordinates, or compare functions at exact x-values in a table you can export.
Fifteen CODATA 2022 physical constants are tokens in the expression language, not numbers you look up and paste. h is the Planck constant everywhere an expression can go, each one carrying its unit and an Exact, Derived or Measured badge — so E = h × f plots where it actually lives, at 10⁻³³.
Every curve carries its own line pattern and token as well as its colour, so four functions on one graph stay four things when colour cannot carry them.
Export the plot as an image or a PDF, or the value table as CSV, straight to the files and apps you already use — from the device itself.
Deliberately focused
Ans Graph is not trying to win a feature-count contest. It concentrates on plotting, exploring and the analysis you need to trust, with numerical approximation treated as a result to explain rather than hide.
The shade, the handles, the value and its uncertainty are one idea — kept together on purpose.
One universal purchase
One purchase covers iPhone, iPad and Mac. Each layout is native to its screen, from a graph you can hold to a full desktop instrument.
Your latest graph reaches the Home Screen as well — a widget in five sizes, two of them for the Lock Screen. It reads one small file in the app's own private container, and nothing else.
See it working
The worked examples take a real question each — the distance a car covers while drag builds, what £10,000 becomes in twenty years, where a mortgage payment goes — and show the formula, the keystrokes and the plot, with every figure checked.
Owned, not rented
Ans Graph works fully offline. There are no accounts, adverts, analytics, trackers or third-party dependencies. Saved graphs stay on your device, and the widget reads only a small local file in the app's own private container. Nothing is sent anywhere. Read the privacy promise.