Worked example · Money
Compound interest: what £10,000 becomes in 20 years
Someone puts £10,000 into a pension and leaves it alone. If it grows at 5% a year, what is it worth after twenty years — and how much of that is growth rather than the money they put in? We will do it on paper, do it on a calculator, then plot it, and finish somewhere more useful: what happens when you keep paying in, and what a 0.75% annual charge is actually taken from.
Where the compound interest formula comes from
Growth of 5% in a year means the balance ends the year as 105% of what it started as. That is a multiplication, not an addition: × 1.05. Do it again the next year and the second year's growth is calculated on the first year's growth as well — which is the whole idea, and the reason the answer is not simply twenty lots of £500.
Multiplying by 1.05 twenty times is 1.0520, so the general form is:
- A amount at the end · P the sum invested · r the annual growth rate as a decimal (5% → 0.05) · n the number of years
With P = 10,000, r = 0.05 and n = 20, the only hard part is 1.0520 = 2.653297705, and then:
Of that, £16,532.98 is growth. Twenty lots of 5% of the original £10,000 would have been only £10,000 — the extra £6,532.98 is the interest that the interest earned.
How to work out compound interest on a scientific calculator
Typed straight in, using the power key — one expression, one press of equals, no writing anything down in the middle:
- 10000
- ×
- 1.05
- ^
- 20
- =
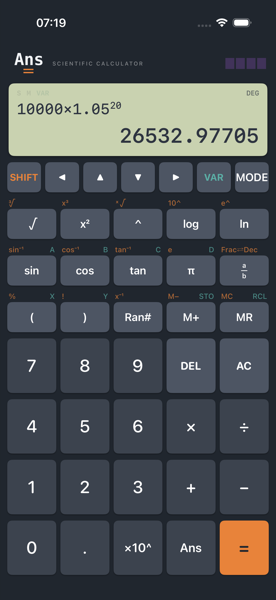
That answer is now in Ans, so the growth alone is Ans − 10000 = without retyping it.
Storing the numbers so you can change one
The interesting question is rarely a single rate. Put the sum in A and the rate in B, and the whole thing becomes reusable — STO is the VAR function of the M+ key, and the letters live on the VAR layer of sin, cos, tan and π:
- 10000
- VAR
- STO
- A
- 0.05
- VAR
- STO
- B
The calculator now holds
- A
- 10000
- the sum invested
- B
- 0.05
- the annual growth rate, as a decimal
Hold VAR at any time to see that panel on the calculator itself. Now the calculation reads like the formula does, and a different rate is one edit rather than a retype:
- VAR
- A
- ×
- (
- 1
- +
- VAR
- B
- )
- ^
- 20
- =
To try 7% instead, store the new rate in B and press ▲ to bring the same expression back, then =. The expression is the model; the variables are the assumptions.
How long until it doubles?
Doubling means (1.05)n = 2, and the tool for pulling an exponent down is a logarithm: n = ln(2) ÷ ln(1.05).
- ln
- 2
- )
- ÷
- ln
- 1.05
- )
- =
The rule of 72. The mental shortcut says 72 ÷ 5 = 14.4 years, which is 0.19 years — ten weeks — adrift here. It is a good estimate at rates near 8% and gets steadily worse away from them. Now that you have the exact expression, you never need the approximation.
Plotting compound growth
A single answer tells you where you end up. The curve tells you how you got there — and compound growth's shape is the point of it. In Ans Graph, type the same formula with the years as x:
f₁(x) = 10000×1.05^x
Set the window to x from 0 to 20 and y from 0 to 30000 — Window… takes the four numbers exactly, so the picture is the one you meant rather than whatever fitted. What you are looking at is not a straight line, and the gap from straight is the compounding:
- the first ten years add £6,288.95;
- the second ten years add £10,244.03.
Same rate, same money, nearly two-thirds more growth in the second decade — because it starts from £16,288.95 rather than £10,000.
Reading the doubling time off the plot
Add a second function at the level you are interested in and let the app find where they meet — the same answer the logarithm gave, arrived at by looking rather than by trusting:
f₂(x) = 20000
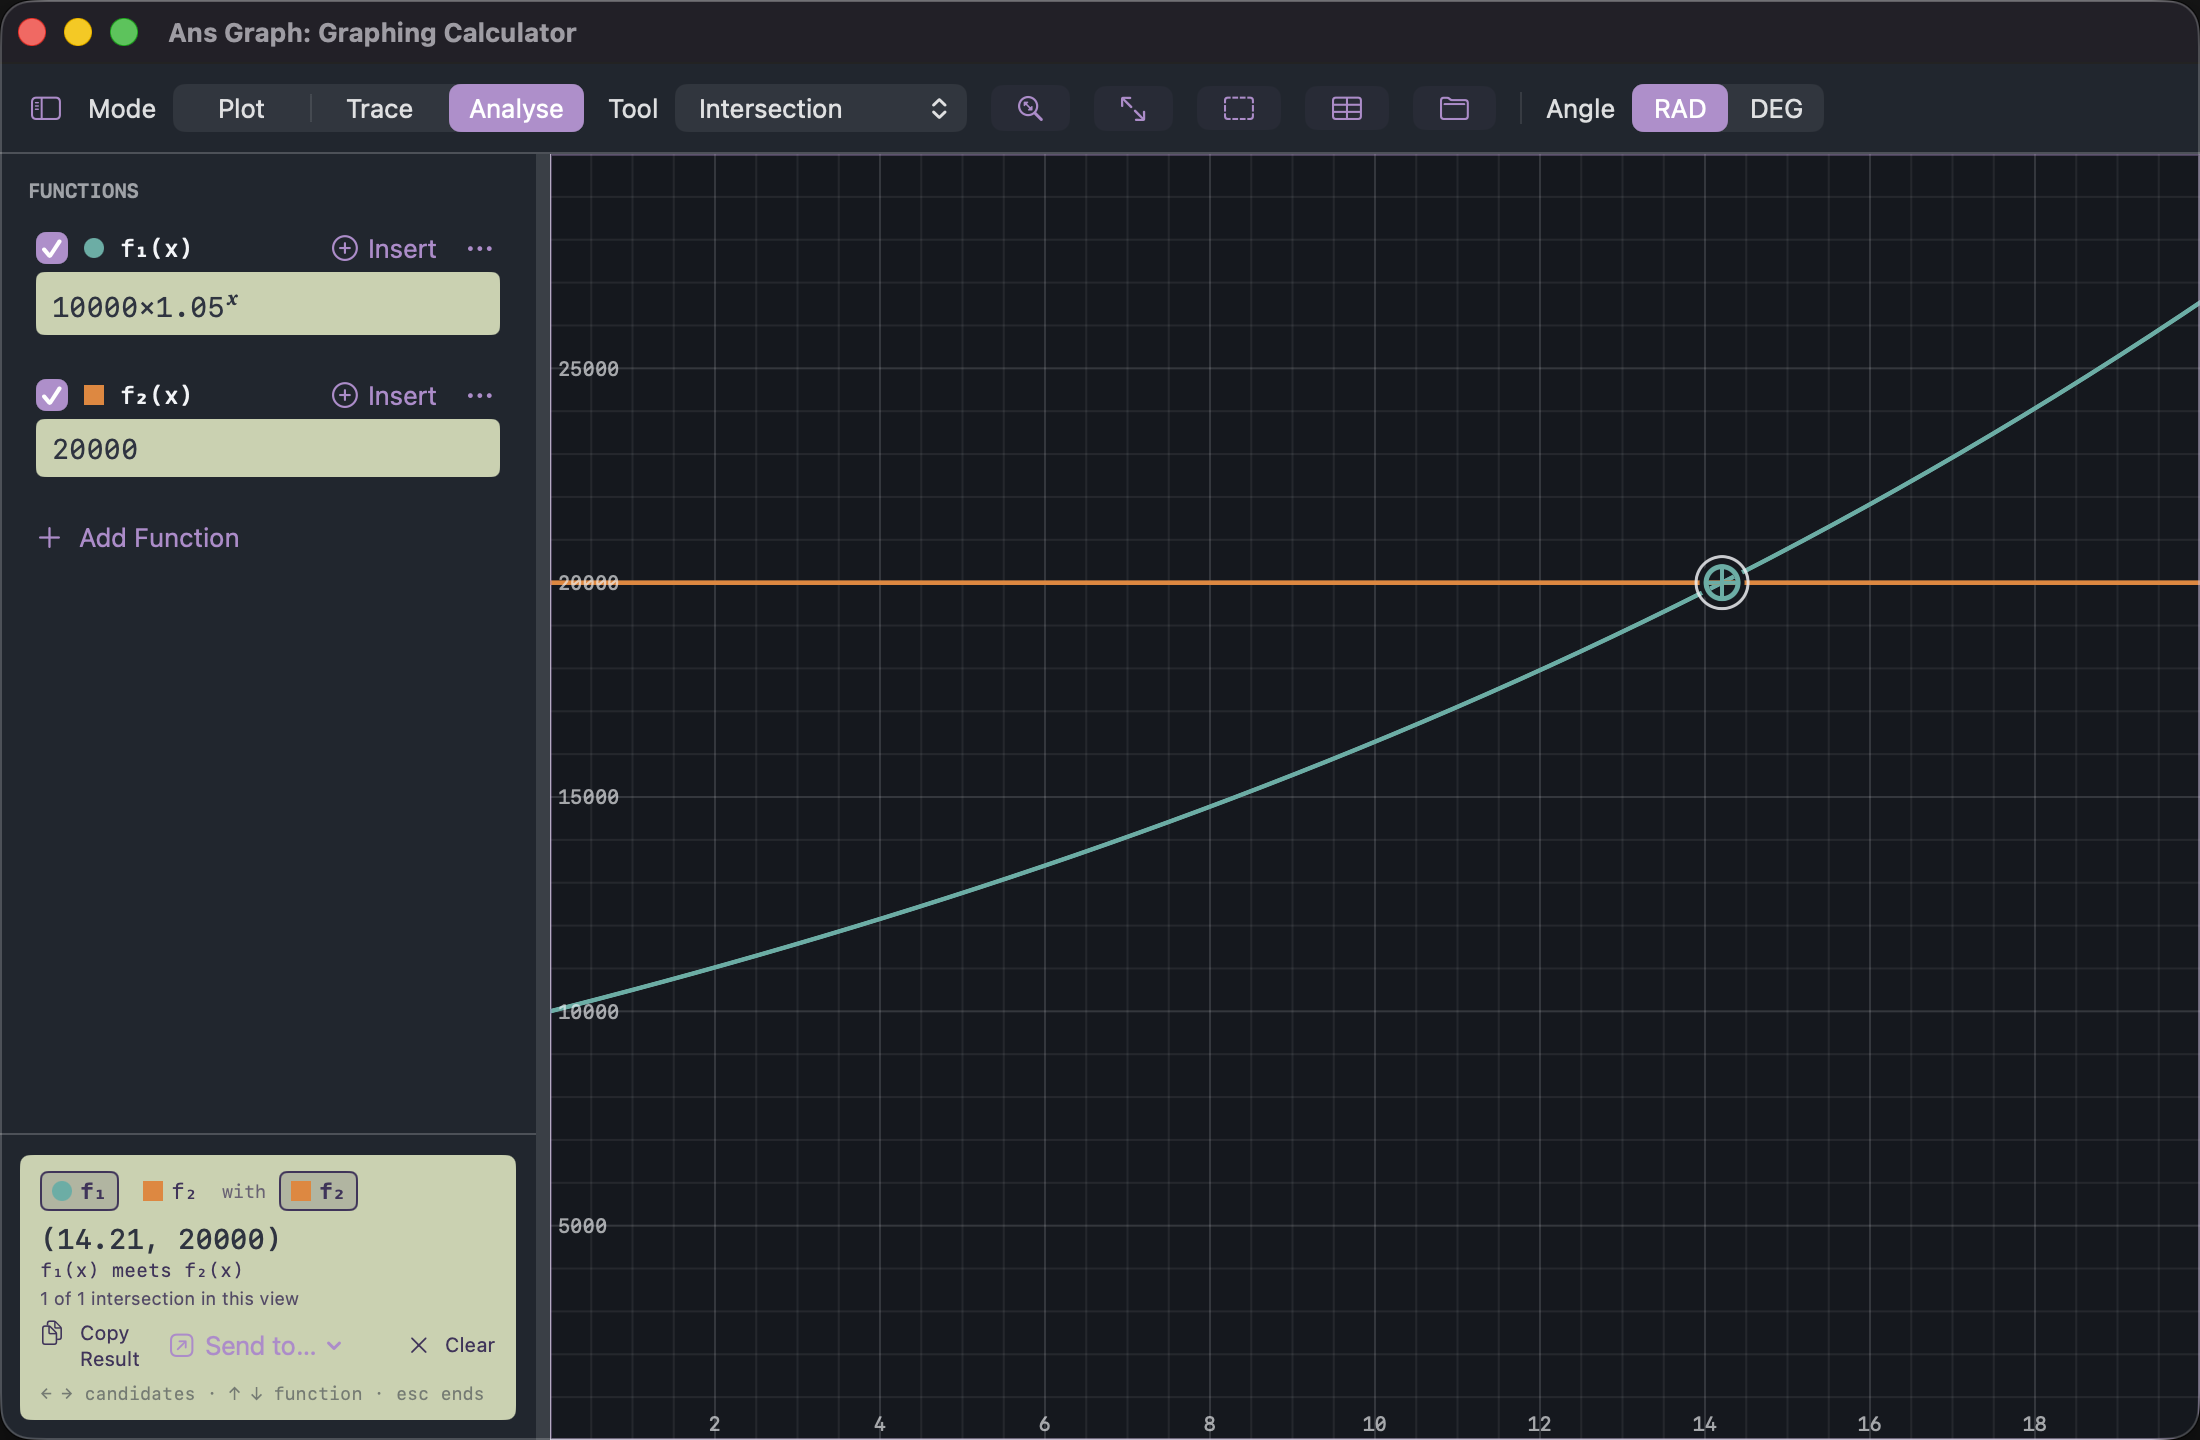
Why it says 14.21 and not 14.20669908. A view twenty years wide is about a thousand pixels across, so one pixel is roughly a week: the crossing is known to within a pixel and no further, and the register states it to the precision the window has earned rather than padding it out with digits it cannot stand behind. Zoom in and the decimals appear as the resolution justifies them. The calculator's 14.20669908 is exact because logarithms are arithmetic, not measurement — which is the difference between the two instruments in one line.
The value table gives the same thing as a column: set the start to 0 and the step to 1 and you have every year's balance, ready to scroll or to export as a CSV file if you want it in a spreadsheet.
Compound interest with regular contributions
Almost nobody invests once and stops. Say the same person also pays in £200 a month — £2,400 a year. Each year's contribution is invested for a different length of time: the first for 19 more years, the last for none at all. Adding those up:
2400 × 1.0519 + 2400 × 1.0518 + … + 2400 × 1.050
That is a geometric series, and it collapses to a single expression — the future value of an annuity:
- C the amount paid in each year · r the annual growth rate · n the number of years
On the calculator, in one line:
Add the original lump sum and the total is £105,891.27. Of that, £58,000 was paid in — £10,000 at the start and £48,000 over twenty years — so £47,891.27 is growth.
Paying monthly is worth more than paying yearly. Everything above credits the £2,400 once a year, at the year end. Paying £200 a month instead means each payment starts earning sooner, so the same annuity formula with r = 0.05 ÷ 12 and n = 240 gives £82,206.73 — £2,848.44 more for exactly the same money. That is the difference between a model and a direct debit, and it is why the assumptions below are worth reading.
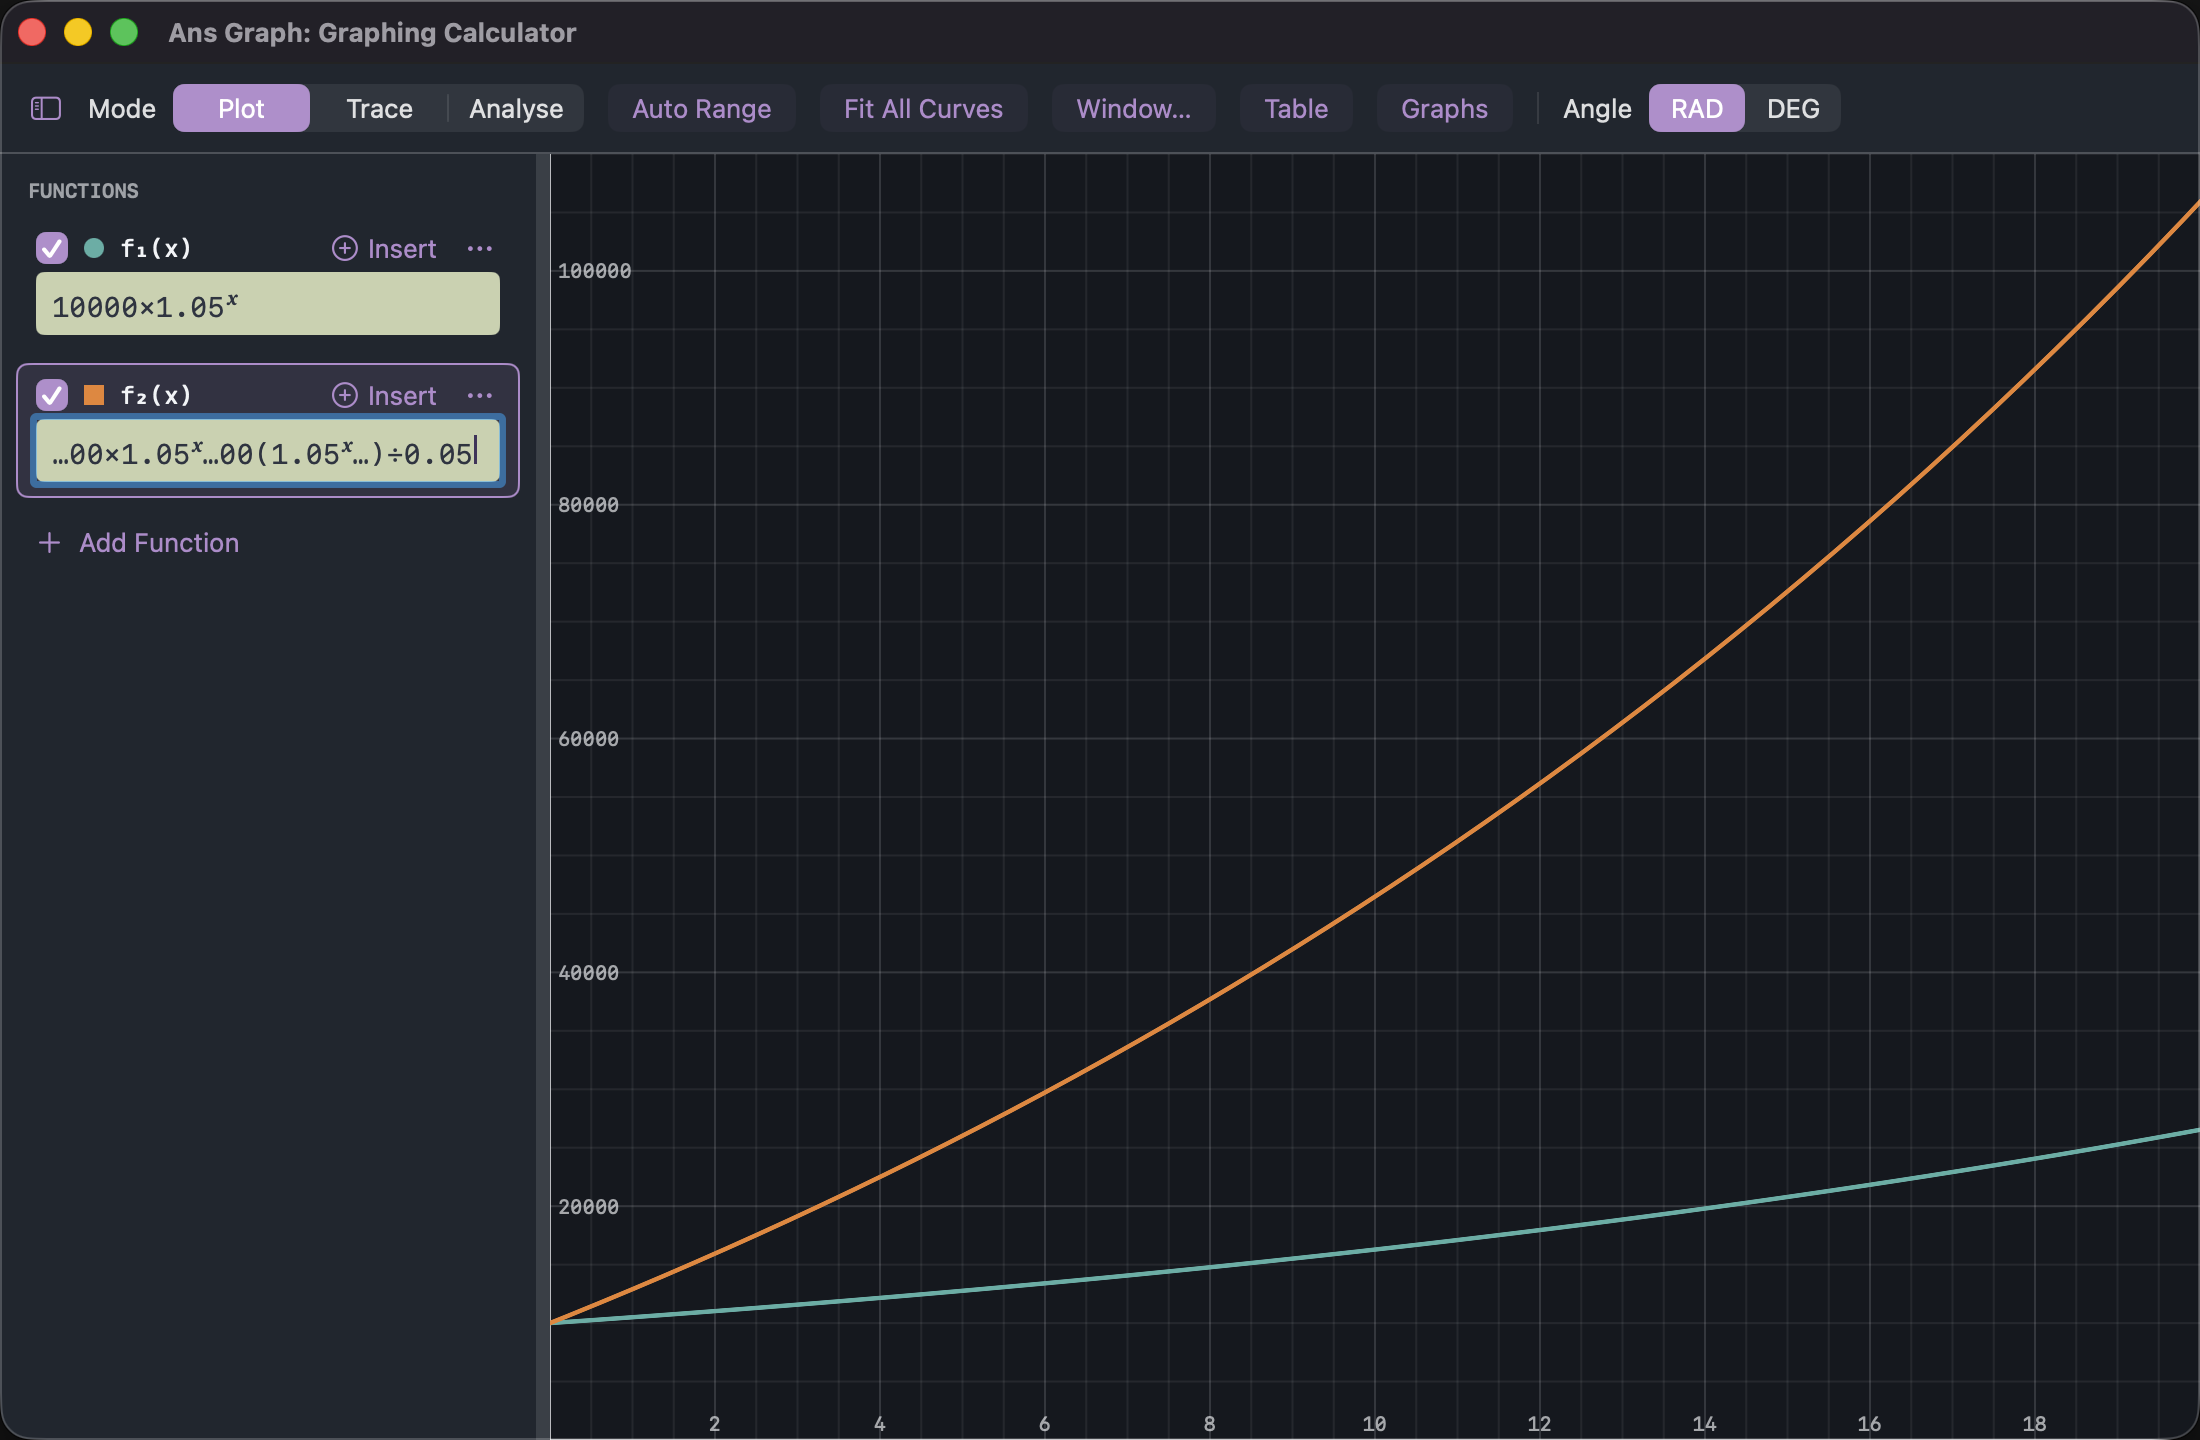
Both together, on one plot, is where the difference stops being a number and starts being obvious:
f₂(x) = 10000×1.05^x+2400(1.05^x−1)/0.05
What the rate is worth
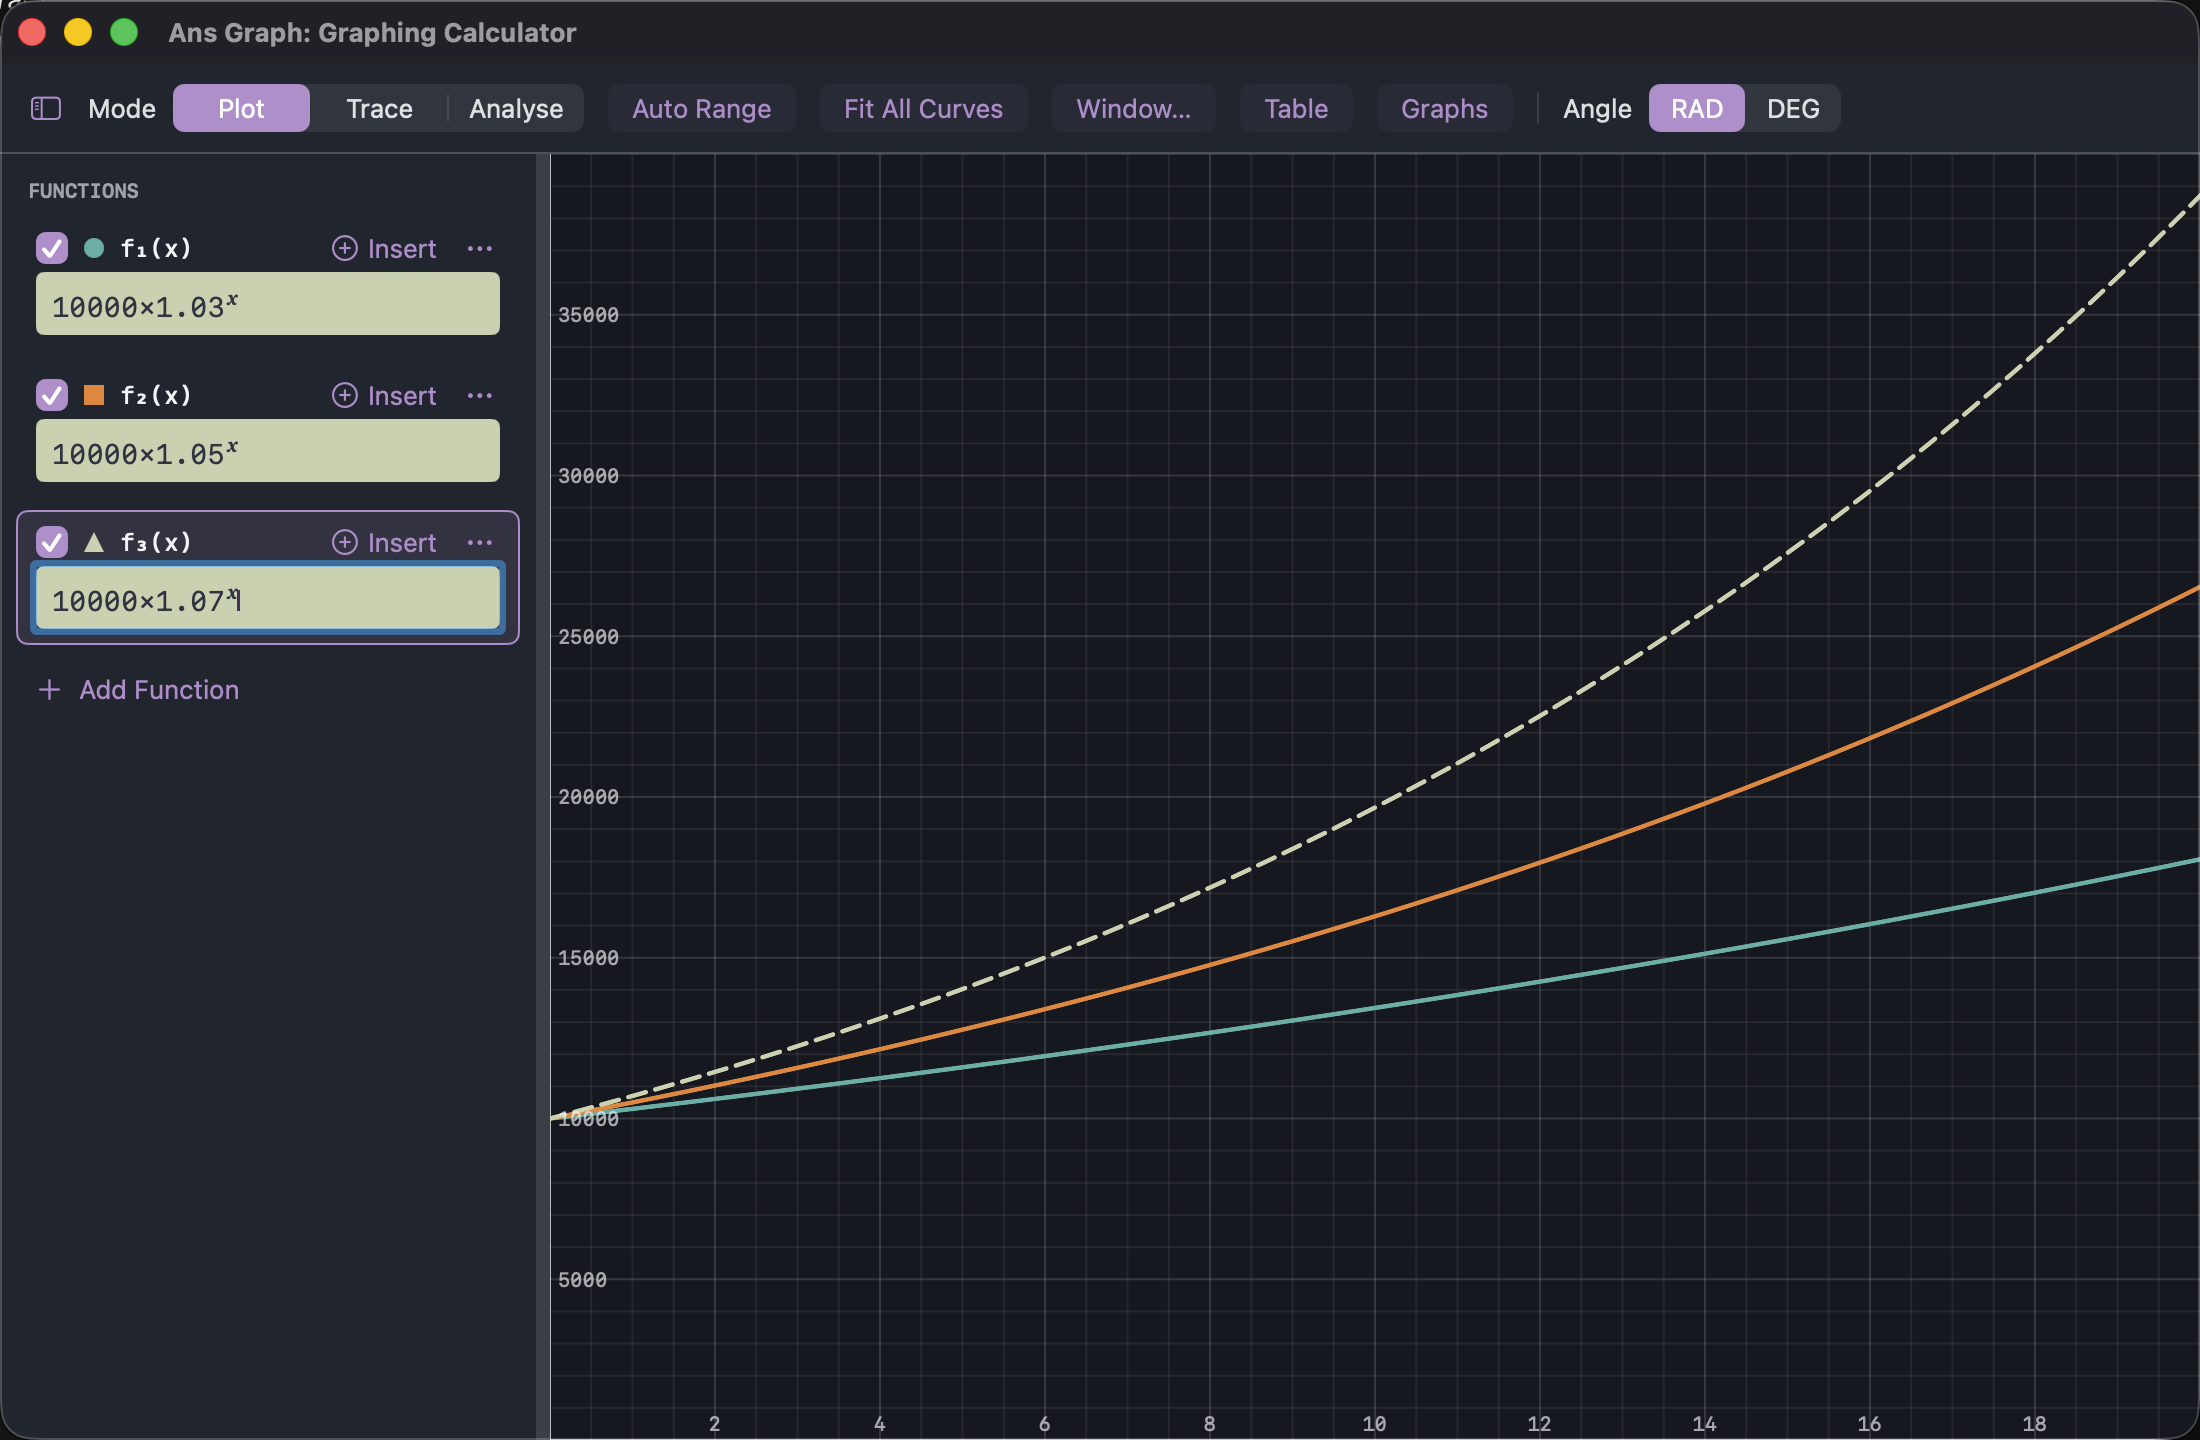
Three rates on one plot answers the question people actually argue about. Same £10,000, same twenty years:
f₁(x) = 10000×1.03^x f₂(x) = 10000×1.05^x f₃(x) = 10000×1.07^x
What a 0.75% annual charge is actually taken from
A percentage fee is not charged on what you paid in, and not on what you end with. It is charged on what the balance is while you hold it — so the honest question is what the average balance was over the twenty years. The average value of a function is its area divided by its width:
Which is exactly what Ans Graph's integral does: choose Integral, set the bounds to 0 and 20, and the region under the balance curve is shaded with its value beside it.
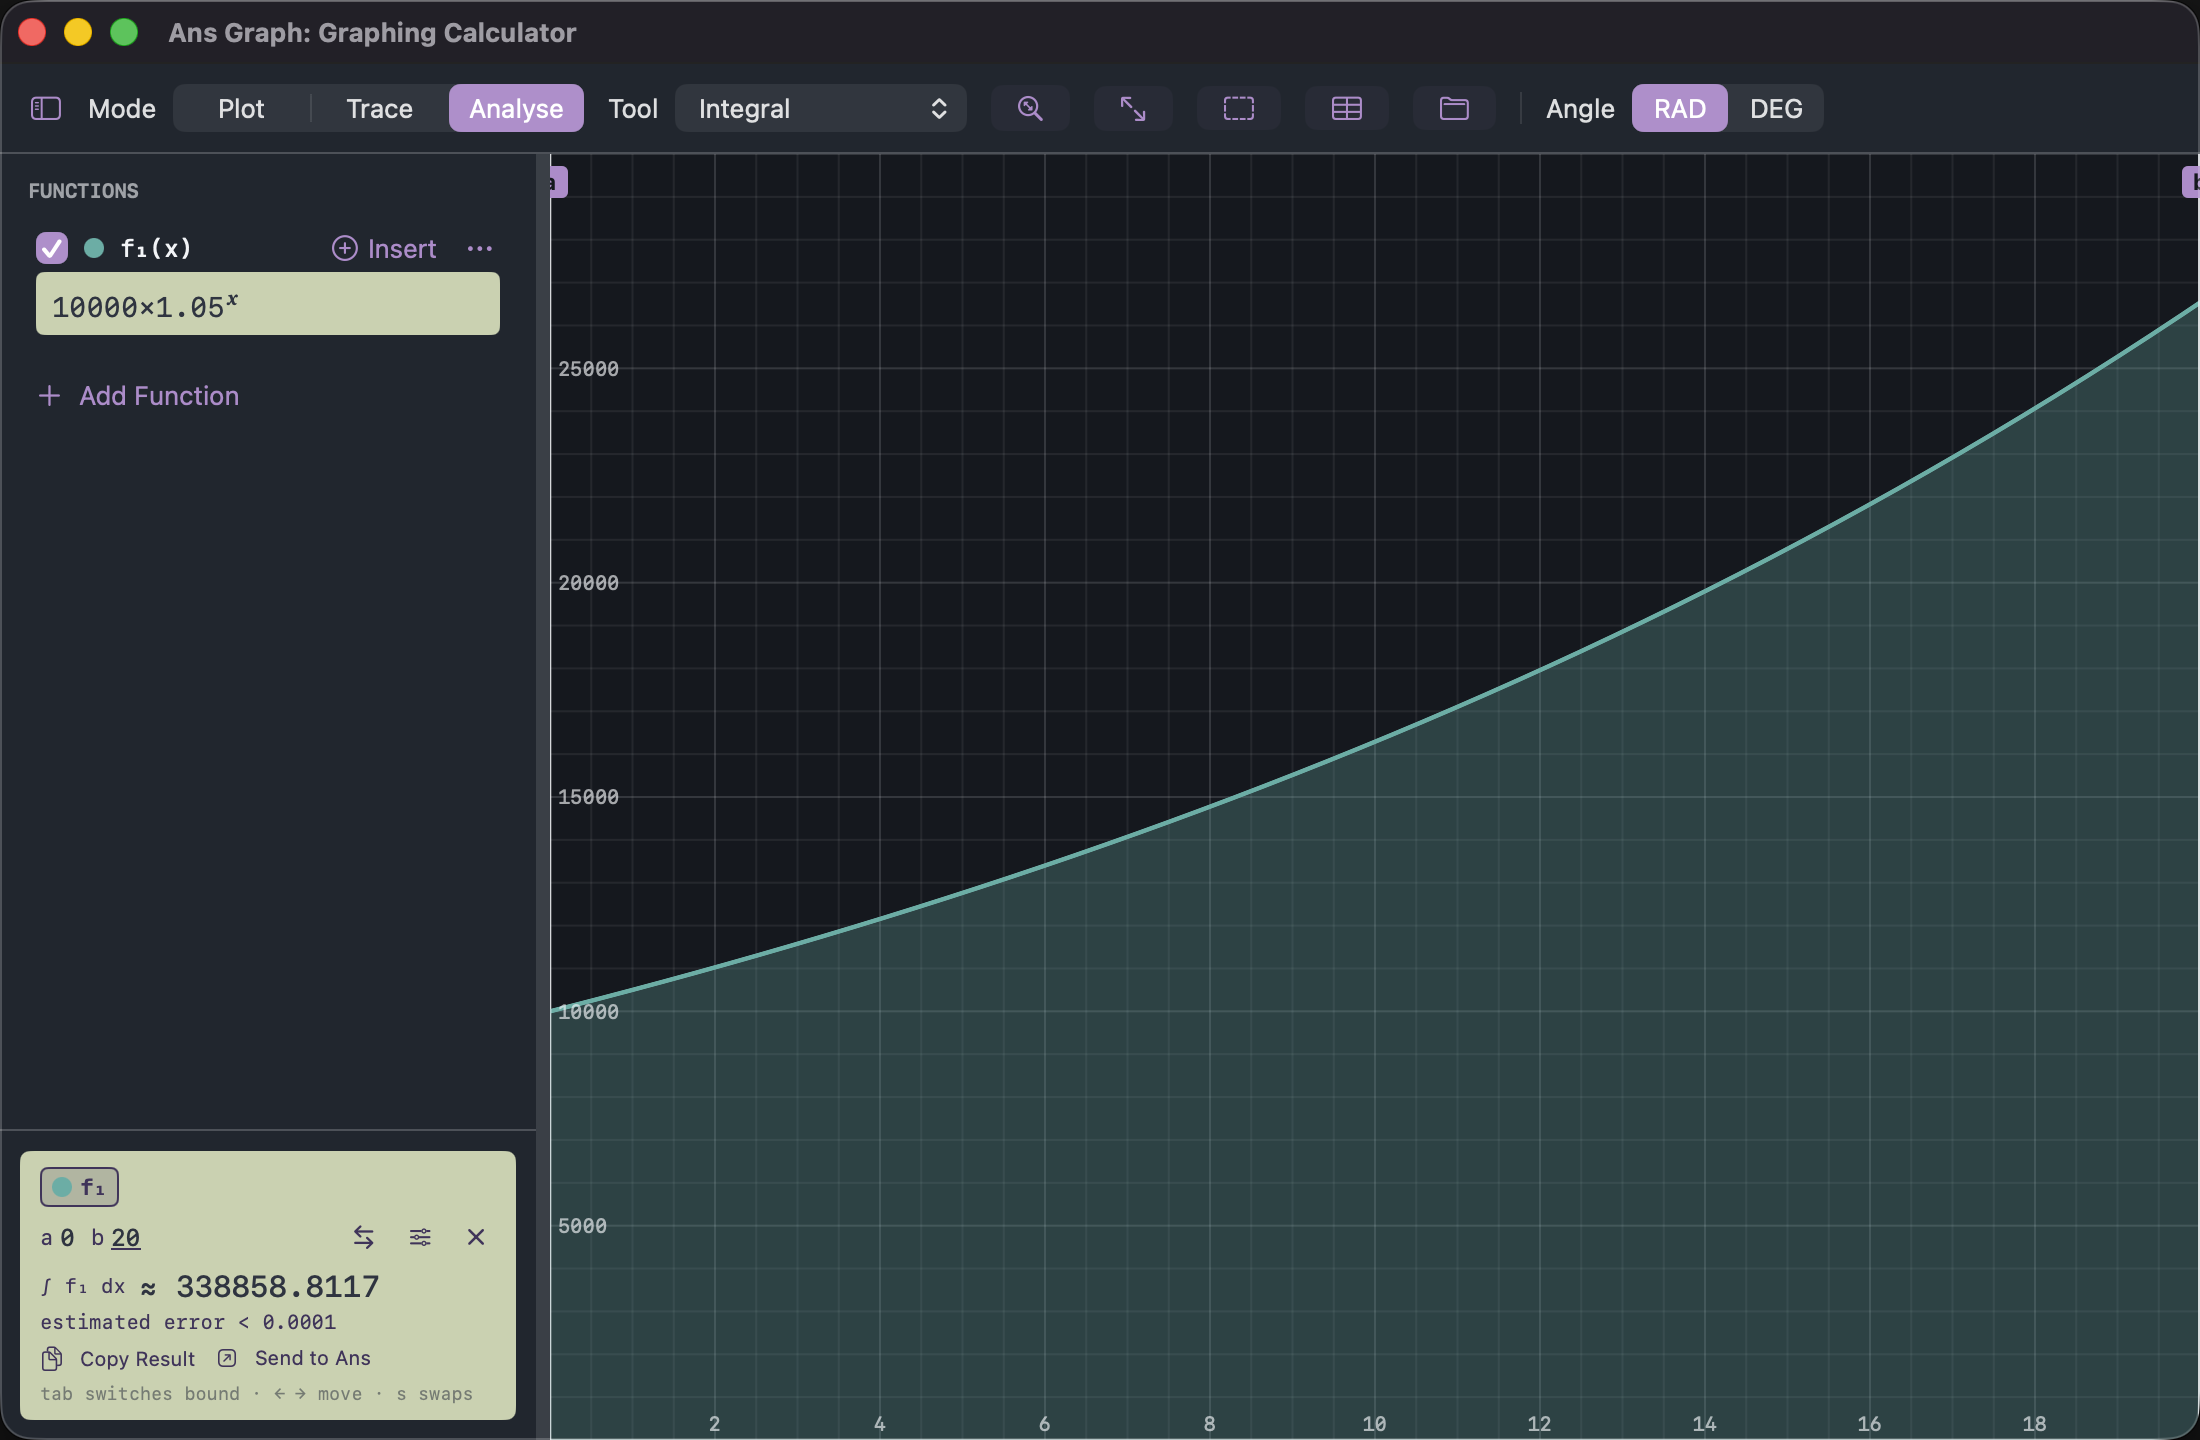
So a 0.75% annual management charge takes about £127 a year — not the £75 that 0.75% of the starting £10,000 suggests, and not the £199 that the final balance suggests. Over twenty years that is roughly £2,500, which is why the number is worth knowing before you agree to it.
Why the integral is approximate and the rest is not. The register shows an estimated error beneath the value because numerical integration works by sampling — it is a very good estimate, not an exact statement. The compound interest sums above are exact arithmetic. An instrument that reports the difference is more useful than one that prints ten digits either way.
The figures, year by year
| Year | Lump sum only | With £200/month | Paid in |
|---|---|---|---|
| 0 | £10,000.00 | £10,000.00 | £10,000 |
| 5 | £12,762.82 | £26,024.33 | £22,000 |
| 10 | £16,288.95 | £46,475.89 | £34,000 |
| 15 | £20,789.28 | £72,577.83 | £46,000 |
| 20 | £26,532.98 | £105,891.27 | £58,000 |
What this model ignores
- Growth is treated as a steady 5% every year. Real investments do not do this; a sequence of good and bad years averaging 5% does not end at the same place, and the order matters.
- Contributions are added once a year, at the end of the year. Paying monthly gives a slightly higher result, because each payment is invested a little longer.
- Charges, platform fees and tax are ignored except where the last step introduces one deliberately.
- Inflation is ignored. £26,532.98 in twenty years does not buy what £26,532.98 buys today; at 2.5% inflation it is worth about £16,200 in today's money.
- This is arithmetic, not financial advice. It shows how the numbers behave, not what anyone should do.
Next: the same mathematics running backwards — where a mortgage payment comes from, or area under a speed–time graph, where the integral above does the real work.
- Free
- No ads
- No tracking
- No account
- Every sum shown in full
Worked on Ans — a scientific calculator you can own and Ans Graph. Paid for once, no subscription, and they work with aeroplane mode on.