Worked example · Money
How much to save a month to reach £20,000
Most savings sums run forwards: put this much away, see what it becomes. The question people actually have runs the other way — I need £20,000 in eight years, so what do I have to pay in? That is the same formula rearranged, and it is worth doing deliberately, because the rearrangement is where the mistakes are.
Turning the savings formula round
Paying a fixed amount in every month, with interest on the growing pot, gives the same geometric series that appears in compound interest. Forwards, it says what a regular payment becomes:
- FV the amount you want at the end · P the payment each period · i the interest rate per period · n the number of periods
You know FV and want P, so divide instead of multiply. The whole fraction moves to the bottom:
Per period, not per year. Saving monthly at 5% a year means i = 0.05 ÷ 12 = 0.0041666… and n = 8 × 12 = 96. Mixing a yearly rate with a monthly count is the single commonest error in this whole family of calculations, and it makes the answer wrong by a factor of about twelve — plausible enough to go unnoticed.
The payment, in one line
Store the monthly rate, because it is the number you will want to change when someone offers you a better account:
- 0.05
- ÷
- 12
- VAR
- STO
- A
Then the growth factor into B, exactly as on the mortgage page — STO works out the line it is given, so no equals is needed:
- (
- 1
- +
- VAR
- A
- )
- ^
- 96
- VAR
- STO
- B
The calculator now holds
- A
- 0.0041666667
- the monthly rate — 5% ÷ 12
- B
- 1.490585468
- (1+A)96 — what £1 becomes in eight years
With both held, the rearranged formula is short enough to read:
- 20000
- ×
- VAR
- A
- ÷
- (
- VAR
- B
- −
- 1
- )
- =
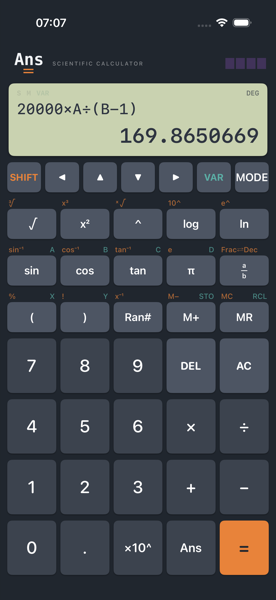
Over the eight years that is £16,307 of your own money and £3,693 of interest. Rounding the payment up to £170 matters here in a way it did not for the mortgage: rounding down leaves you short of the goal, and a goal is the whole point.
Putting the payment on the x-axis
Every graph so far in these examples has had time along the bottom. It does not have to. Here the useful question is what happens as the payment changes, so let x be the monthly payment and plot what each one reaches after 96 months:
f₁(x) = x(1.0041666667^96-1)/0.0041666667 f₂(x) = 20000
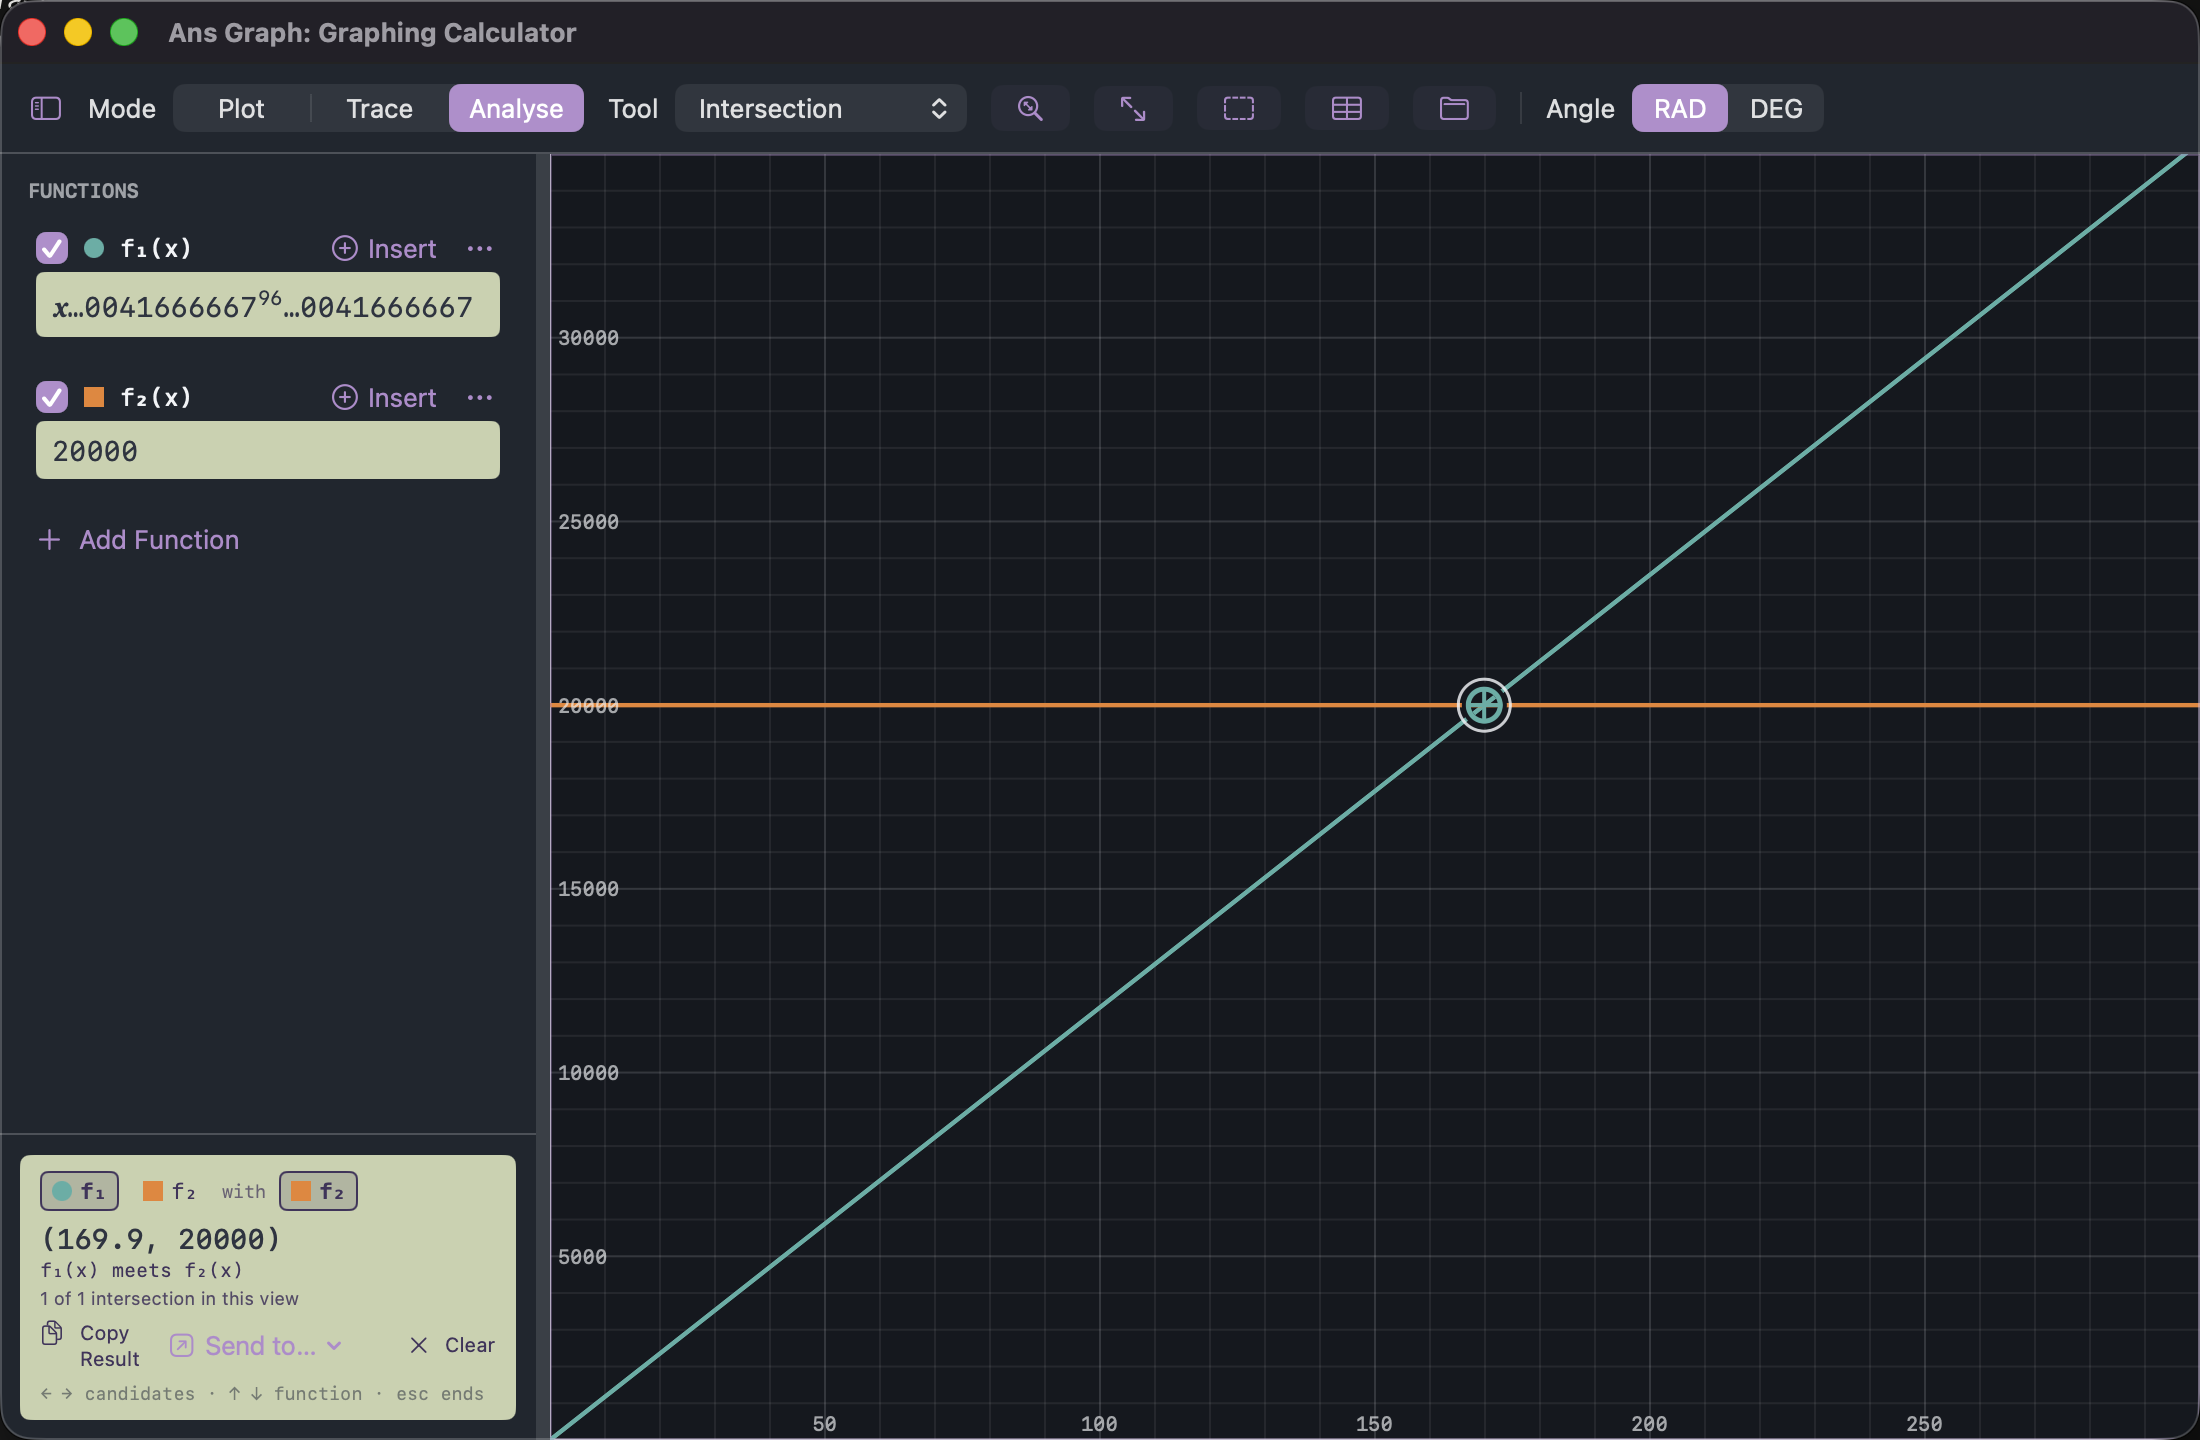
The line is straight, which is worth a moment. Compound interest is famous for curving, and the total certainly curves against time — but against the payment it is perfectly proportional: double what you put in each month and you double what you end with. All the curvature lives in the factor 117.74, not in x.
And that makes the graph genuinely useful rather than decorative. Slide along it and you can read off what any budget reaches, or what any target costs, without solving anything again. Choosing what goes on the x-axis is part of the modelling, and time is only the habitual answer.
Starting earlier, and starting with something
Two changes are worth testing, and both are one keypress now that the model is in variables.
Give it ten years instead of eight
Bring back the line that built B, change 96 to 120, and run the payment again. The goal drops to £128.80 a month — a 24% smaller payment for two more years of patience, and the interest earned rises from £3,693 to £4,544.
Start with £5,000 already saved
A lump sum you already hold grows on its own, so it only has to be subtracted from the target before the payment is worked out. The £5,000 becomes 5000 × B = £7,452.93 by itself, leaving £12,547.07 for the payments to cover:
| Plan | Monthly payment | You pay in | Interest does |
|---|---|---|---|
| 8 years from nothing | £169.87 | £16,307 | £3,693 |
| 10 years from nothing | £128.80 | £15,456 | £4,544 |
| 8 years, £5,000 already saved | £106.57 | £10,230 + £5,000 | £4,770 |
Time is the cheapest ingredient in every row. Two extra years cut the monthly cost by £41 and let interest do a quarter more of the work — which is the same lesson the compound interest example reaches from the other direction, and the reason both pages exist.
The working, in order
| Quantity | Expression | Value |
|---|---|---|
| Monthly rate | 0.05 ÷ 12 | 0.0041666667 |
| Growth factor over 96 months | (1+A)96 | 1.490585468 |
| Annuity factor | (B−1) ÷ A | 117.7405123 |
| Monthly payment | 20000 ÷ 117.7405123 | 169.8650669 |
| Total paid in | 169.8650669 × 96 | 16307.04642 |
| Interest earned | 20000 − 16307.04642 | 3692.95358 |
| Paying at the start of each month instead | 169.8650669 ÷ (1+A) | 169.1602326 |
What this model ignores
- A fixed 5% for the whole eight years, compounded monthly. Real savings rates move, and a rate quoted as AER is not the same as 5% ÷ 12 applied monthly — close, but not identical.
- Payments arrive at the end of each month. Paying at the start earns one extra month of interest on every payment, so the same goal needs £169.16 rather than £169.87 — divide the answer by (1+A). Seventy pence a month, or £68 over the eight years.
- Tax on interest is ignored, as are ISA limits, bonuses, introductory rates and any account that restricts withdrawals.
- Inflation is ignored. £20,000 in eight years does not buy what £20,000 buys today; at 2.5% it is worth about £16,415 in today's money.
- This is arithmetic, not financial advice. It works out what a plan requires, not whether the plan is a good idea.
Next: compound interest, the same series read forwards, or mortgage repayments, where the same rearrangement works against you.
- Free
- No ads
- No tracking
- No account
- Every sum shown in full
Worked on Ans — a scientific calculator you can own and Ans Graph. No account, no upload, and nothing about your money leaves the device.